The cyclical trend remains under pressure as money moves towards the U.S. dollar. The stronger dollar is either the cause or the effect of the weakness in crude oil prices but, either way, will continue to trend higher until oil prices find some kind of bottom.
If we were to pick a likely near-term target for crude oil it would be in the 70 -72 range. Our view is that Brent crude futures are headed back to 80 and while the spread between Brent and West Texas Intermediate (WTI) is contracting it will probably hold for now in the +8 to +10 range.
If crude oil moves down to 70 then look for the Canadian dollar futures to squeeze lower into the .9400 range.
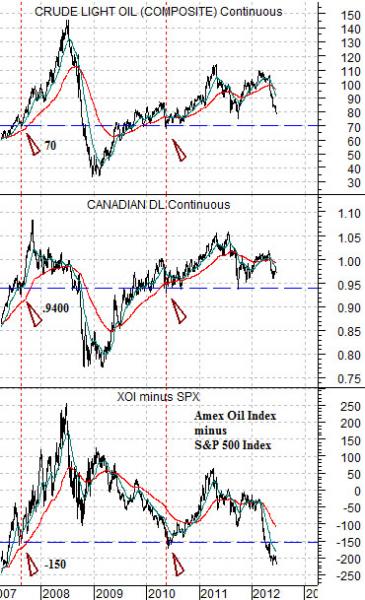
At right is a chart comparison between crude oil futures, the Canadian dollar futures, and the spread or difference between the level of the Amex Oil Index (XOI) and S&P 500 Index (SPX).
We have argued (quite often) that the equity markets actually ‘lead’ commodity prices. On any given day one is likely to read that the oil stocks were higher because oil prices moved upwards but from a broader perspective it actually makes more sense to argue that oil prices were higher because oil stocks had previously been showing strength.
In any event… the oil stocks have been losing relative strength since the middle of 2008 and have been in fairly concentrated down trend since the end of the first quarter of 2011. Which means, by the way, that the trend for oil prices is considerably weaker than most realize.
In 2007 and again in 2010 the XOI declined to around 150 points below the SPX. In both instances crude oil futures prices were very close to 70 while the Canadian dollar was almost dead on .9400.
The problem at present is that the XOI is now more than 200 points below the SPX so there is no guarantee that crude prices will find significant support at 70 or that the Cdn dollar will manage to hold at .9400. However, for the time being those levels represent the most logical chart points for the cyclical trend to make some kind of bottom.
Equity/Bond Markets
We were actually feeling quite positive with regard to the equity markets. Until yesterday. However, we are going to stay in our usual state of denial and lean towards a bullish outcome for the time being.
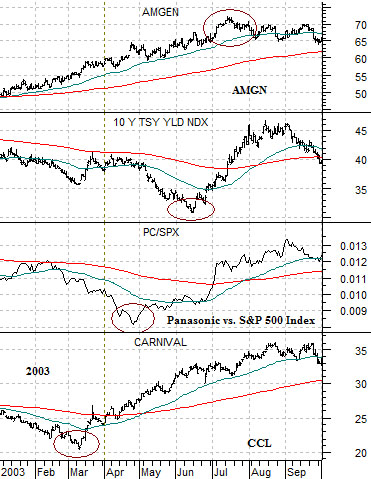
Below is a chart of Amgen (AMGN), 10-year Treasury yields, the ratio between Panasonic (PC) and the S&P 500 Index (SPX), and the share price of Carnival (CCL) from 2003.
The sequence begins in March of 2003 as the share price of Carnival turned upwards. This went, by the way, with the start of a fairly serious correction for crude oil as prices declined from 38 down to 25 over a six-week period.
By late April Panasonic began to outperform the broad U.S. large cap market (i.e. PC/SPX ratio turned upwards). This marked the low point for the cyclical trend and the impending bottom for oil prices.
In June 10-year yields finally reached a cycle bottom. A month or so later the share price of Amgen finally rose to a top.
The point is that the sequence that led into the start of serious cyclical asset price strength and a multi-year low for long-term yields began with an upturn for Carnival in response to energy price weakness. The non-commodity stocks (Amgen) continued to grind upwards until a few weeks after long-term yields pivoted higher.
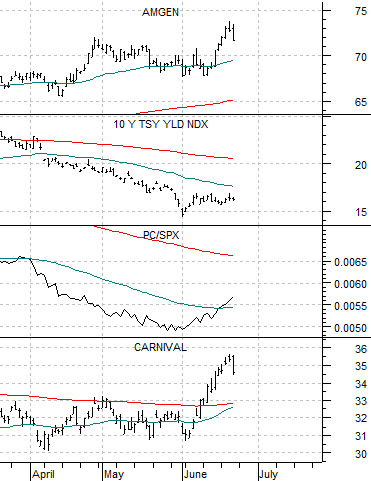
Our view was that we could be in the early stages of a similar trend. Energy prices have been weaker and the share price of Carnival was on the rise. The damage to the Japanese stock market from the rising yen was in the process of turning back to a more bullish trend while yields were still under pressure due to falling energy prices. In other words… if the sequence today resembled that of 2003 we were somewhere close to the end of March.
Why are oil prices declining? One answer would be that the trend has been rather intensely negative since the end of 2011. From this perspective a better question would be… why haven’t oil prices been declining?
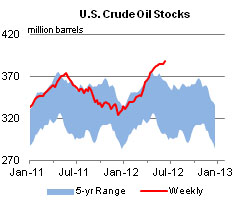
For those who prefer actual fundamental reasons we offer the chart below from the U.S. Energy Information Administration web site. The chart shows U.S. crude oil inventories (red line) compared to the 5-year range. Notice that crude oil inventories are well above the average range and, apparently, are destined to head even higher. For good or for bad the best way to correct an excess of inventory is to slash prices.