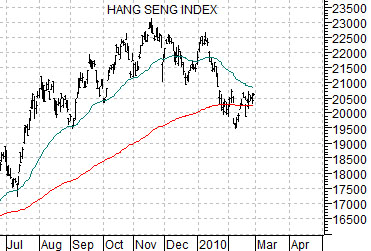
Below is a chart of Hong Kong’s Hang Seng Index. Our focus today is not on whether the Hang Seng Index will rise or fall but rather what it will mean in terms of the cyclical trend if it moves higher or lower from current levels.
At present the Hang Seng Index is hovering just above its 200-day exponential moving average (e.m.a.) line (red line on chart). Weakness into February was sufficient to pull the 50-day e.m.a. line (blue line) down towards the 200-day.
We have argued that the Hang Seng Index tends to trend with Asian growth, commodity prices in general, copper prices in particular, and long-term U.S. Treasury yields. In other words weakness in the Hang Seng tends to reflect a trend towards slower Asian (i.e. China) growth along with lower commodity prices and interest rates.
Further below is a chart of the CRB Index along with an overlaid chart of natural gas futures (in black) and two moving average lines for the Hang Seng Index. The red line is the 200-day e.m.a. while the green line is the 100-day e.m.a.
One of our somewhat infrequent arguments has been that the trend for natural gas prices tends to turn positive when the moving average lines for the Hang Seng Index ‘cross’ to the upside and turns negative when the lines ‘cross’ to the down side.
The next chart shows that while the Hang Seng Index may have peaked in late 2007 the moving average lines did not ‘cross’ until the end of the second quarter in 2008. Given that this marked the peak for both the CRB Index and natural gas futures prices and the start of the financial markets melt down… our thought is that we should pay close attention to the position of these moving average lines in the days and months ahead.
The argument would then be that as long as the Hang Seng Index holds at or above its 200-day e.m.a. line (currently around 20,300) the cyclical trend should remain nicely positive. Of particular concern would be a decline back below the February bottom at 19,500. If this went with corresponding strength in the share price of Wal Mart (which typically trends higher when Asian growth is slowing) then a more defensive posture (bonds, yen, dollars, etc.) would likely be warranted.
Equity/Bond Markets
We are going to get into this in more detail in tomorrow’s issue but the basic near-term trend for the equity markets is negative. Not only is the trend bearish but it will remain that way until the oil stocks stop underperforming crude oil prices and the Japanese yen stops pushing upwards.
The bad news is that the trend is in some ways as negative as it has been since the second half of 2008. The good news might be that the stock markets haven’t collapsed and… equity markets rallies have built out of the month of March on many occasions in recent years.
The bottom line is that the longer the negative action within the markets continues the greater the risk of a very sharp decline in the major equity indices. On the other hand we can make a case for a very bullish outcome… from these or lower levels. Our view is that the equity markets should exit the month of March with some upward momentum while our hope is that price gains won’t come from substantially lower levels.
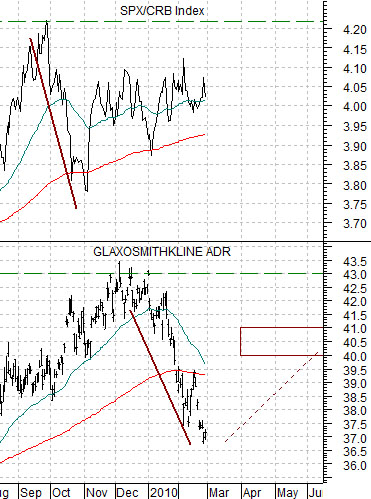
Below we show a chart comparison of GlaxoSmithKline (GSK) and the ratio between equities (S&P 500 Index) and commodities (CRB Index).
In our comments above we noted that stocks will remain under pressure until the oil stocks stop weakening relative to oil prices. The oil stocks versus crude oil relationship represents a specific ‘spin’ on equities versus commodities.
We have argued that the SPX/CRB Index ratio has tracked the share price of GSK over the past 15 years. The idea is that if we can this literally then the collapse in the ratio in 2008 down to 2.7 forecast the eventual lows for GSK in early 2009 of 27. The rally by the ratio back above 4.2 in September of last year led the rise in the share price of GSK into the 42- 43 range.
Now… this obviously may not work in the days to come but the thought was that if the SPX/CRB Index ratio resolves back up to 4.2 then the basic trend for GSK should be higher. If we get ‘core’ stocks in the pharma sector trading 10% or 20% below what we view as chart-based ‘fair value’ then we have a difficult time being overly negative with respect to the equity markets.
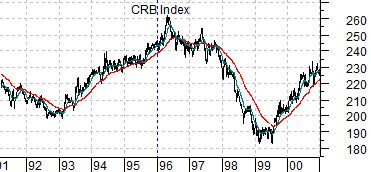
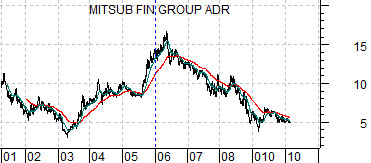
Further below we have added a comparison between the CRB Index from 1991 through 2000 with the share price of Japan’s Mitsubishi UFJ (MTU) from 2001 to the present time period.
In a sense we are comparing the Japan theme today with commodity prices back in 2000. Why? Because the Nikkei peaked in 1990 while the CRB Index hit its prior generational peak ten years earlier in 1980.
The point is that in 1999 investors were so caught up in the tech and telecom sectors that commodity prices and the share prices of the commodity cyclicals were largely ignored. Even so… after peaking in the spring of 1996 (10 years ahead of the highs for MTU in the spring of 2006) and bottoming in March of 1999 (exactly 10 years in front of the lows for MTU in 2009) the commodity sector enjoyed a very positive run through all of 2000. Our thought is that if the ‘Japan theme’ is going to work it may have to do so over the balance of this year given our expectation for slower cyclical growth through 2011 and 2012.