SHANGHAI (Reuters) – The ChiNext stock market (0#CHINEXT.SZ), China’s long-awaited Nasdaq-style second board, debuted on Friday with a speculative surge that more than doubled the price of all 28 stocks during intraday trade — a good sign for companies lining up to list on China’s stock markets.
Our oft-mentioned ‘decade trend’ is based on the similarities exhibited by the markets over the past three or four decades. Asset price bubbles tend to build into the start of a new decade only to be followed by a couple of years of slowing growth. The double recessions between 1980 and 1982, the 1991 recession, and the 2001- 2002 post-Nasdaq bear market serve as examples.
One of the challenges at present- at least from a North American perspective- is that the equity and commodity markets are calling for a ‘V-shaped’ recovery even as economists debate the likelihood of something closer to a ‘U’, ‘W’, or even an L. In other words there is a disconnect between the markets’ message and the econometric perception of reality.
We have argued that both the markets and the economists may well be right. Equity prices are rising because China is heading into a Nasdaq-type bubble while long-term U.S. Treasury prices are holding because the U.S. economy remains weak.
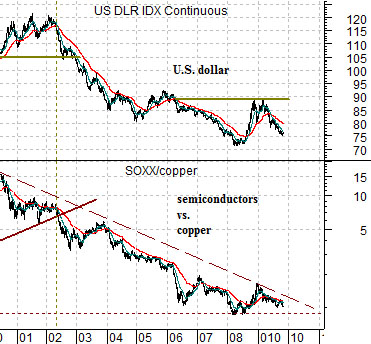
At top right we compare the U.S. Dollar Index (DXY) futures and the ratio between the Philadelphia Semiconductor Index (SOX) and copper futures. In a ‘weak dollar’ trend copper prices will rise relative to the equity values of the major chip stocks. Each time the dollar starts to rise the stock market seems to collapse largely because we have yet to get to the point where any cyclical driver other than China (Chindia, BRIC, etc) has shown up.
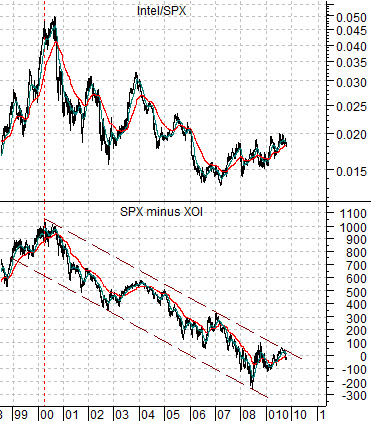
At bottom right we compare the ratio of Intel (INTC) to the S&P 500 Index (SPX) with the spread or difference between the SPX and the Amex Oil Index (XOI). From 2000 into 20009 the trend has favored the oil stocks (i.e. the spread is declining down a fairly well defined channel) as Intel’s share price has weakened against the broad market. To change the trend all we would really have to see is the SPX rising somewhat more than 50 points above the XOI. This would go eventually- if not immediately- with dollar strength along with better relative action in the tech sectors.
Equity/Bond Markets
We were jumping from topic to topic somewhat on today’s first page. The argument was that Chinese asset prices are moving into a bubble similar to commodity prices into 1980, the Japanese real estate market into 1990, and the Nasdaq into 2000. The Bloomberg comment with regard to China’s Nasdaq-style market fits the thesis quite nicely.
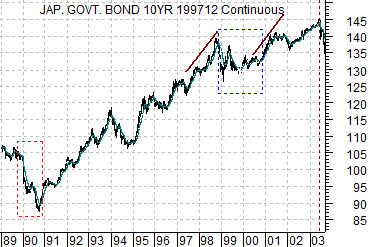
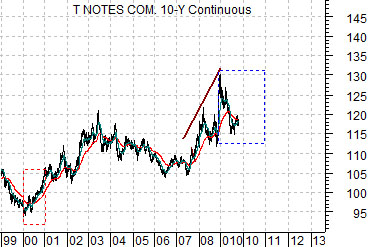
The charts at right compare the Japanese 10-year bond (JGB) futures from 1989 into 2003 with the U.S. 10-year T-Note futures from 1999 to the present time period. This perspective makes quite a bit of sense to us.
Following the peak in Japanese asset prices in 1990 bond prices continued to rise all the way through into 2003. The rising trend took a year or so off during the Nasdaq’s ascent through 1999.
Our sense is that the U.S. trend is similar- with a ten year lag- to that of Japan. Our sense is that bond prices have been falling this year on Chinese strength in the same manner that Japanese bond prices declined in 1999 in response to U.S. strength. Our sense is that when the Chinese asset price bubble breaks some time next year it will result in a period of cyclical weakness that will ultimately carry U.S. long-term yields to new lows.
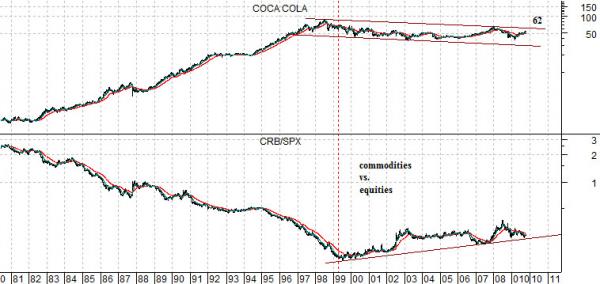
With this in mind we compare the share price of Coca Cola (KO) with the ratio of commodity prices (CRB Index) to equity prices (S&P 500 Index).
The trend that began in 2000 included tech sector weakness (page 1) and a long period of outperformance by crude oil and the share prices of the oil producers (page 1 as well). On top of this it went with a decade-long correction in the share price of KO and a concurrent rise in the commodity/equity ratio.
In our scenario the maturing trend of speculative Chinese asset price growth carries through into 2010 but on the other side of this trend we are faced with the very real potential for deflation. As long as the U.S. bond market refuses to buckle there is a very real chance that it is already discounting the ‘other side’ in a manner almost identical to the JGBs in late 1999.