From an intermarket perspective the share price of Coca Cola (KO) and the Canadian dollar (CAD) represent two opposing trends. The Cdn dollar does better during periods of stronger cyclical growth with an emphasis on buoyant energy and metals prices while Coke represents a consumer growth theme that tends to show relative strength when there is sufficient slack in the economy to hold interest rates lower. In other words. in general and over time… the share price of Coke will tend to be weaker when the Cdn dollar and commodity prices are stronger.
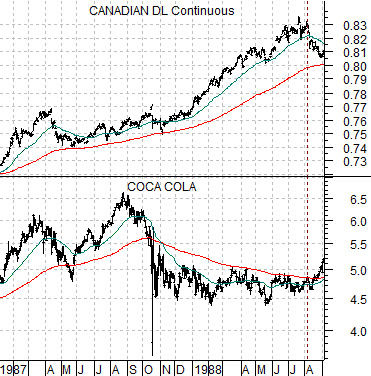
We use the term ‘in general and over time’ for a reason however. A long-term chart comparison would show the relationship fairly clearly but over shorter time spans there have been occasions when both have trended together. To explain we show at top right the comparison between the Cdn dollar and Coca Cola between the start of 1987 and August of 1988.
Crude oil prices collapsed at the end of 1985 and then turned higher once again during the second half of 1986. The argument is that weak energy prices helped propel the bond market upwards during 1986 and as the commodity cyclicals kicked back into gear the broad stock market gained almost frenetic momentum. More simply put… things were so hot into 1987 that almost everything was rising at the same time.
Pressures built within the markets until the stock market literally ‘crashed’ during the autumn of 1987. At this juncture the markets were faced with a decision point. Either the ‘crash’ preceded an economic down turn which would raise bond prices and support the stock price of Coca Cola or… it would mark a pause during an ongoing commodity price bull market. Either the Cdn dollar would rise or Coke would resolve upwards. The chart shows that from the autumn of 1987 through the summer of 1988 the clear winner was the commodity sector.
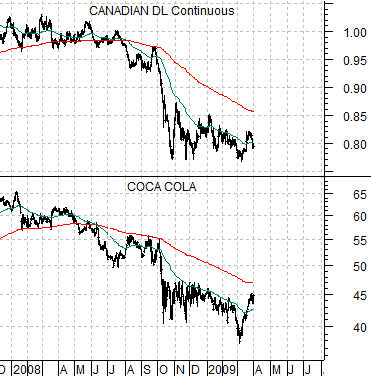
Below right we show the same comparison for the current time period. Notice that the charts are virtually identical which means that we have just waded through almost the exact opposite situation that occurred pre-crash in 1987. Our view is that when Coke and the Cdn dollar trend lower together the markets have a decision to make with respect to near-term economic growth and cost-push inflationary pressures. Either Coke resolves back up through its 200-day e.m.a. average to reflect a flat to negative commodity markets trend- which has been our expectation- or the Cdn dollar kicks back into gear on its way back up through .85.
Equity/Bond Markets
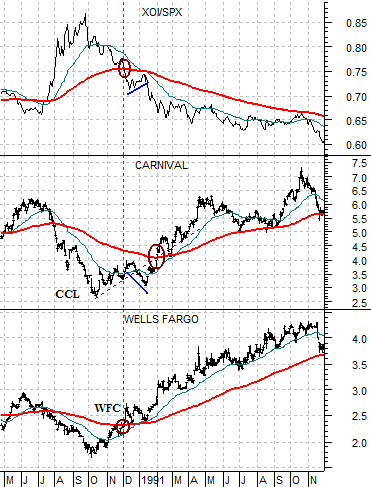
We are not really sure when it was that we came up with the idea to compare the share price of Wells Fargo (WFC) to the ratio between the Amex Oil Index (XOI) and S&P 500 Index (SPX) but we do know that it was literally years and years ago. To some extent it may have been based on Warren Buffett’s decision to buy Wells Fargo’s shares towards the end of 1990 and our observation that while many financials remained under pressure through most of 1991 this one particular stock did very well.
The argument was that the low point for the equity markets during the bear market of 1990 was made at the peak for the XOI/SPX ratio and as this ratio resolved back below its 200-day e.m.a. line the broad stock market recovered and… WFC’s share price pushed back up through its 200-day e.m.a. line.
Some time last year we tweaked the argument by adding the share price of Carnival Cruise Lines (CCL). We use CCL to represent the broader ‘cyclical energy-using’ theme. In other words CCL does better during periods of stronger economic activity while also being sensitive to energy costs.
The ‘cyclical energy-using’ theme represents any number of sectors including the autos and airlines. What we like about CCL is that it is leveraged to energy prices while operating within an industry with high barriers to entry. In other words while almost anyone (or so it seems at times) can lease a few planes and try to make a few bucks operating a cut-rate low-cost discount airline it is much more difficult to get into the cruise ship business.
In any event the peak for the XOI/SPX ratio in September of 1990 marked the low point for the equity markets in general and the start of a rising trend for both WFC and CCL.
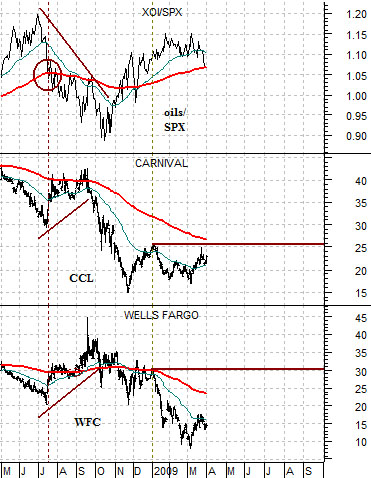
At bottom right we show the same comparison for the current time frame.
The XOI/SPX ratio peaked- as one might expect- with crude oil prices at the end of the second quarter of 2008 and as it moved down through its 200-day e.m.a. line the share prices of both WFC and CCL began to lift. So far, so good. The recovery continued through into September and then the world fell apart. From October into March the oils returned as relative strength favorites along with gold prices and the stock prices of the major gold miners.
We mention all of this because the XOI/SPX has started to decline once again to the point where it is now sitting on its 200-day e.m.a. line. In terms of the argument this is exactly when and where the markets were supposed to start rotating money back into the themes represented by WFC and CCL.
Before we get too far ahead of ourselves and after having been thoroughly chastened by last year’s failed recovery we need to incorporate another detail or two into our thesis. Specifically- we will show this in more detail on the following page- the relative strength not only of the oils but also of gold prices along with another perspective on the relative strength of the financials. All things considered, however, with the XOI/SPX ratio back on the moving average line we have to admit to a certain sense of cautious optimism.