Oct. 13 (Bloomberg) — Intel Corp., the world’s biggest chipmaker, forecast sales and profitability that topped estimates, indicating that computer demand is returning to pre- recession levels. The shares jumped 6.4 percent… Intel’s report kicked off two weeks of earnings by big U.S. technology companies, including International Business Machines Corp., Google Inc. and Microsoft Corp. The use of Intel’s chips in everything from laptops to supercomputers makes its sales a barometer of industry demand.
With Intel (INTC) reporting earnings after the close yesterday we thought that this might be an appropriate time to show a chart comparison that argues that the stock market rally may have further to go that most expect. So many investors seem intent on picking the top and timing the turn these days that we find this perspective somewhat appealing.
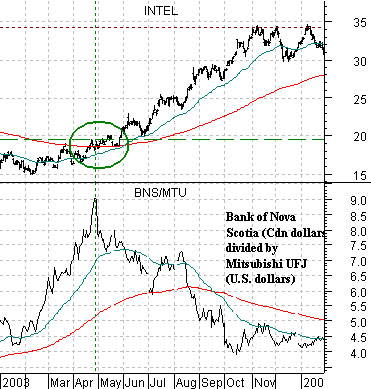
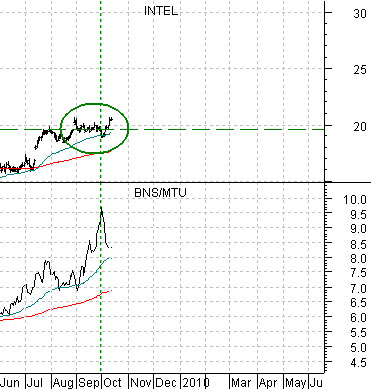
Below is a comparison between Intel and the ratio between the share price of Canadian bank Bank of Nova Scotia (in Cdn dollars) and Japanese bank Mitsubishi UFJ (BNS/MTU) from the start of 2003 through January of 2004. The set the stage somewhat the S&P 500 Index bottomed in October of 2002, tested the lows once again in March of 2003, and then pushed higher through into the first quarter of 2004.
The BNS/MTU ratio peaked in late April of 2003 as Intel’s share price struggled to find a foot hold over the 20 level. In other words the markets had been favoring Canadian banks in Canadian dollars through into the spring of 2003 as the tech sector worked through a bottom following the Nasdaq’s post-2000 bear market.
How similar was this to the current situation? While our argument might well be based on mere coincidence the point is that at the end of September the BNS/MTU ratio peaked for a second time. The ratio touched 9:1 in 2003 before sliding back to 4:1 and has recently pushed just beyond 9.5:1.
If the ratio made a cycle peak at the end of September then it did so once again with Intel’s share price struggling to move above 20. If history were to repeat- which, we could argue, might be a first for us- then the broad rally could continue through into the second quarter of next year with Intel approaching a price equal to about 3% of the value of the S&P 500 Index. As long as Intel holds its 50-day moving average line the trend should remain nicely positive.
For the sake of argument let’s go with the idea that the Chinese stock market has actual downside potential. If so… then there are three relationships that we need to keep an eye on.
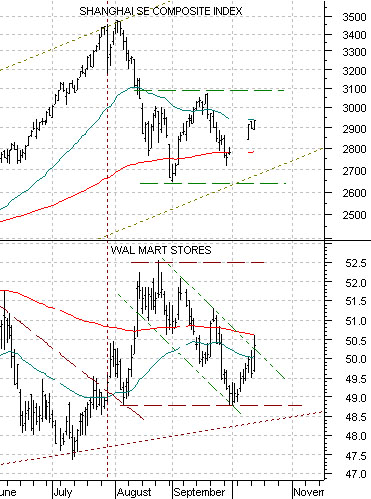
The first relationship has to do with the share price of Wal Mart (WMT). WMT has tended to trend lower for long periods of time but when it does swing higher it usually means that the cyclical cycle associated with copper prices, crude oil prices, or Asian growth is starting to turn negative.
The chart below compares WMT with the Shanghai Composite Index. Notice that WMT pushed up from its July lows just ahead of the recent peak in Chinese shares. The rally top for WMT in late August marked the first bottom for the Shanghai Comp. so- in theory- a move back above 52.50 should coincide with some kind of pressure on the Asian stock markets.
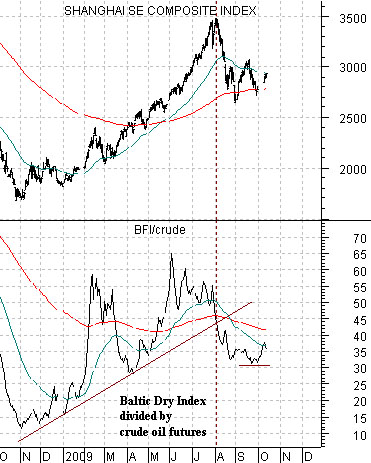
Below we feature the Shanghai Comp. along with the ratio between the Baltic Dry Index (BFI) and crude oil futures. Chinese stock prices are fairly sensitive to ocean bulk shipping rates which also tend to trend with long-term Treasury yields as well as energy and base metals prices. To the extent that ocean freight rates continue to weaken relative to crude oil prices… we can make the case that the Shanghai Comp. is at risk.
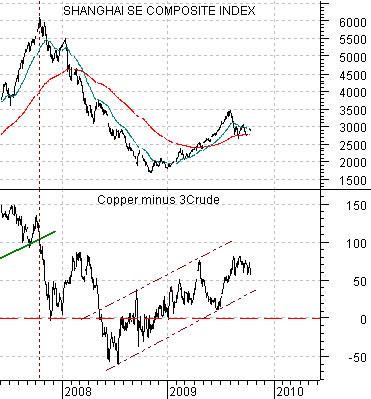
The third relationship that we are showing today has to do with the spread or relative strength between copper and crude oil futures prices. When copper is ‘stronger than’ crude oil this usually reflects Asian economic strength while a negative trend tends to develop when copper is ‘weaker than’ crude oil. The spread is based on copper futures prices in cents minus three times crude oil futures in dollars. With crude oil still trading above 70 it would take something closer to 2.00 for copper futures to swing the spread back below the ‘0’ line.