We imagine that it is obvious that crude oil prices are rising due to concerns about potential disruptions in supply. The problem is that what is ‘obvious’ and what is ‘real’ may not be the same thing.
We mentioned in passing in yesterday’s issue that if oil prices are rising as a result of an excess of demand then the dollar will tend to be weaker and the cyclical sectors will tend to outperform. In other words if global growth is strong enough to push energy prices higher chances are the dollar will be trending lower, interest rates will be rising, and economically sensitive sectors will be attracting capital inflows.
If, on the other hand, oil prices are rising due to a shortage of supply then the dollar will tend to be stronger, yields will start to decline, and capital will tend to flow towards the defensive sectors.
Our point is that while it may seem obvious that rising oil prices are more supply-driven than demand-driven at present the markets have yet to confirm the new trend. The dollar is no better than flat, yields are still trending somewhat higher, and we have not seen anything more than the barest hint that money is starting to flow towards the defensive sectors.
To us rising energy prices feel like a return ‘on trend’ after crude oil was largely left behind by the surge in commodity prices.
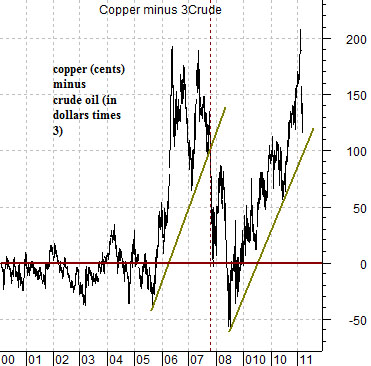
Just below we show a chart of the spread between copper (in cents) and crude oil (in dollars times 3). The argument is that over time this spread will tend to swing (rather wildly) back and forth through the ‘0’ line as copper prices push upwards followed by a ‘catch up’ for crude oil. With copper north of 4.00 the argument is that crude oil could well test or exceed the highs of 2008 as prices rebalance.
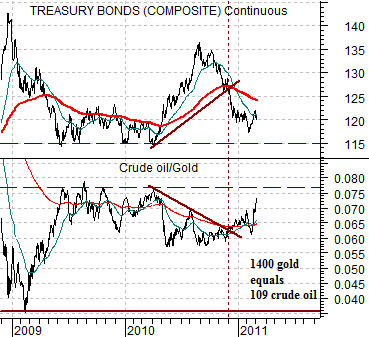
Below is a chart of the U.S. 30-year T-Bonds and the ratio between crude oil and gold futures.
The argument here is that the downward trend for bond prices (as the TBonds grind back towards 115) is lifting the crude oil/gold ratio. As long as gold remains above 1400 the ratio is driving crude oil prices up towards and then potentially right through 109- 110. Our point is that the issue really isn’t the current rising trend for energy prices as much as it is the recent rising trend for metals prices. Crude oil is simply swinging higher under the cover of Middle Eastern tensions as prices move back into balance.
Equity/Bond Markets
It seems that whenever we get into the month of March we tend to start thinking about trend changes and pivots. Why? The Nasdaq, for example, made a major ‘bubble’ peak in March of 2000 while the S&P 500 Index made its post-crisis bottom in March of 2009. The S&P 500 Index had a mini-crash in March of 1994 and made the final low in the post-Nasdaq bear market in March of 2003. While there is likely nothing more important about the month of March than the other eleven months… it does tend towards the dramatic every now and then.
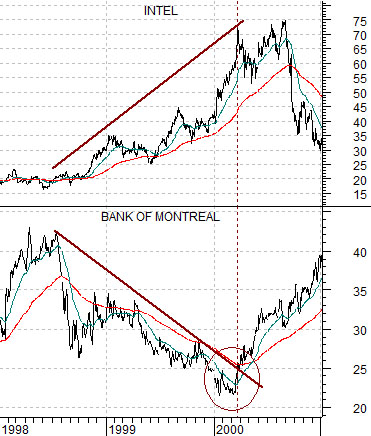
Below is a chart of Intel and the Bank of Montreal (BMO) from 1998 through 2000.
The argument is that the tech and telecom trend peaked in March of 2000 while the sectors showing offsetting weakness made bottoms that month. In other words the sectors on the rise peaked in March while the sectors under pressure bottomed in March of that year.
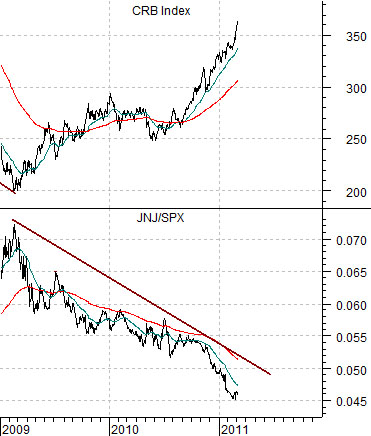
Next we show the CRB Index and the ratio between Johnson and Johnson (JNJ) and the SPX from the current time period.
The JNJ/SPX ratio has made a tiny (miniscule, almost imperceptible, etc.) bottom in recent days. The chart argues that this ratio will likely bottom when the CRB Index stops rising. Is the JNJ/SPX ratio an ‘offset’ and, if so, will strength in this ratio indicate an end to the surge in commodity prices?
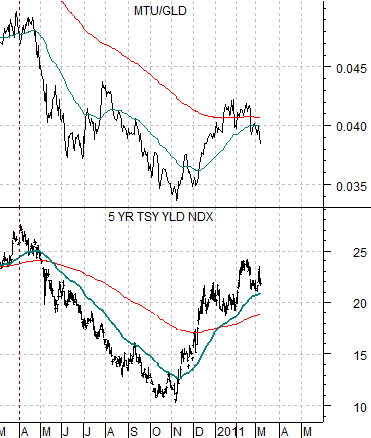
Quickly… last is a chart of 5-year Treasury yields and the ratio between Mitsubishi UFJ (MTU) and the gold etf (GLD). Our argument was that the laggard banks/gold ratio bottomed with yields in the autumn of last year and that as yields move higher (5-year yields lead short-term yields) the banks should outperform gold. The trend is a bit shaky this month but 5-year yields are still on the rise.