March 26 (Bloomberg) — Former Federal Reserve Chairman Alan Greenspan said the recent rise in Treasury yields represents a “canary in the mine” that may signal further gains in interest rates.
In certain respects the markets cycle today is similar to 2004. The S&P 500 Index swung positive in March of 2003 as well as March of 2009. By March of 2004 U.S. long-term bond prices were declining in response to upward pressure on short-term yields. Bond prices bottomed in May as TBill yields rose above the Fed funds rate and in June the Fed raised interest rates as long-term bond prices pivoted back to the upside.
If the current time period follows the same basic path then short and long-term yields would continue to rise through April until TBill yields had finally moved above .25%. A case could be made that the Fed would respond at the next meeting- in this case April 28th- with a hike in the funds rate which would, in turn, set the stage for a rally in the long end of the bond market.
The simplicity of the comparison intrigues us. Both short and long-term rates would move higher until TBill yields were well above .25%, the Fed would respond with a funds rate hike, and then long-term yields would correct back to the down side.
Aside from the fact that so many economists have argued that the Fed will not raise the funds rate until 2011 or perhaps 2012… even we have a small problem with this scenario. We aren’t arguing against is but are merely attempting to point out that while 2010 is similar to 2004 it is almost- in certain ways- almost the exact opposite.
What created the upward pressure on yields in 2004? We have argued in the past that it was ‘strong energy prices’. Heating oil futures, for example, pushed to all-time record highs in mid-2004.
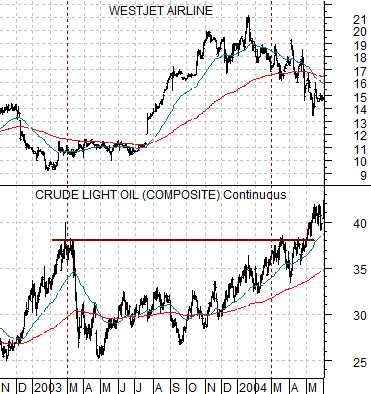
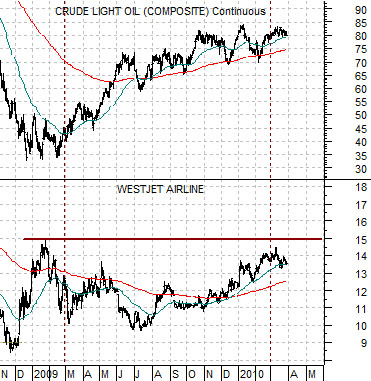
What is currently creating upward pressure on yields? What market is rising with the kind of momentum exhibited by energy prices in 2004? What market is capable of dominating the trend for the next several years? Our ‘small problem’ is that we really don’t know aside from the fact that it isn’t the energy sector. At top right we compare airline WestJet (WJA on Toronto) and crude oil futures from late 2002 into mid-2004. Below right we show the same charts from late 2008 to the present day.
The point? WestJet today looks like crude oil in 2004 and crude oil today looks like WestJet in 2004. Similar charts with a completely different perspective.
Equity/Bond Markets
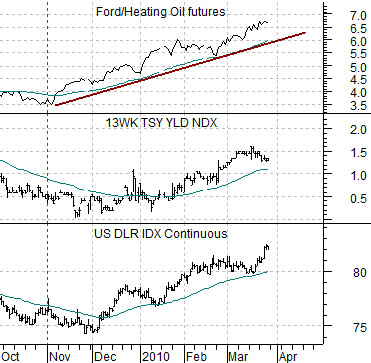
Above is a chart comparison between the U.S. Dollar Index (DXY) futures, U.S. 3-month TBill yields, and the ratio between Ford (F) and heating oil futures.
The Ford/heating oil futures ratio represents energy ‘users’ versus energy ‘prices’. We showed WestJet on page 1 today because one of the key trends associated with upward pressure on yields appears to be the recovery in cyclical energy ‘user’ sector. In other words… better action in the autos and airlines in response to downward pressure on energy prices as the dollar trends higher.
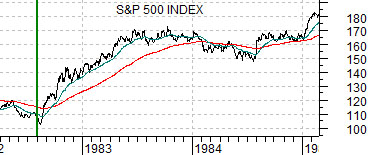
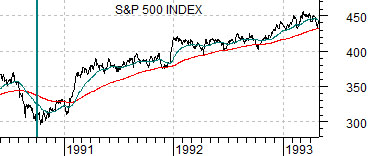
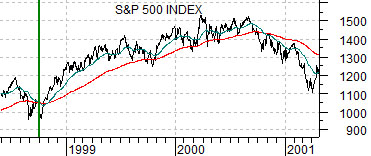
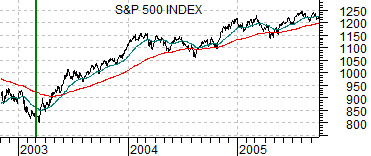
At right are five charts of the S&P 500 Index. The charts cover the time periods following the equity markets lows set in 1982, 1990, 1998, 2003, and 2009.
The question is… after more than a year of strength in the equity markets… is it time to cut and run? Our sense is that it depends in large part on one’s investment time frame.
One of our ongoing concerns is that we still do not know if 2009 marked a major bear market bottom or if it was merely a part of the standard ‘decade theme’. The ‘decade theme’ suggests that crises tend to occur in the ‘7’ and ‘8’ years and that these are followed by a frantic rally to a cycle peak in the ‘0’ year. In other words following the stock market ‘crash’ in 1987 the SPX rose to a peak into mid-1990 while the Asian crisis that ran through 1997 and 1998 set the stage for an asset price peak in 2000.
The issue is, in a sense, that this might be a repeat of 1990 and 2000 or it could also be something closer to 1983 and 2004. The strange thing is that it actually doesn’t seem to matter… quite yet. If last year was a major cycle bottom then the stock market’s rally has further to go both in terms of price and time. If, on the other hand, it is a post-crisis rally then the 1990 and 2000 examples suggest that pressures should begin to show up during the second half of this year.