As best as we can tell the dollar’s trend is essentially flat. It could quite easily tilt to the upside in the near term or, perhaps, swing back to the down side but for now the trend is no better and no worse than neutral.
The chart below compares crude oil futures and the U.S. Dollar Index futures.
Arguing that the dollar is ‘flat’ may seem somewhat unimportant but the point is that there is a strong relationship between oil prices and the dollar.
The chart shows that from the day that the dollar bottomed around the end of April the trend for crude oil futures has been lower. In this instance even a flat dollar is weighing on oil prices. We have shown in the past that the trend for crude oil is similar to that of the CRB Index divided by the U.S. Dollar Index. In other words when the dollar is weaker oil prices rise faster than the CRB Index and when the dollar is stronger crude oil prices tend to under perform general commodity prices.
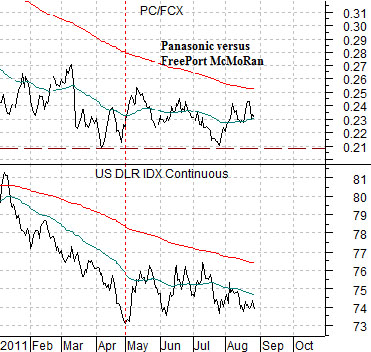
For now anything between 73 and 76 for the DXY futures maintains the flat trend.
Below we feature the DXY futures once again along with the ratio between Panasonic (PC) and FreePort McMoRan (FCX).
Both PC and FCX are somewhat economically sensitive or… cyclical. Both do better during periods of time when yields are rising but the key for relative price performance comes from the direction of the dollar.
A pervasively weaker dollar will favor the commodity cyclicals with FCX outperforming PC. A stronger dollar, on the other hand, will tend to create a trend that leads to better action in the U.S. and Japanese stock markets with a focus on tech and the consumer cyclicals. Our example shows that PC will tend to do better than FCX when the dollar swings higher.
The basic argument here is that dollar has stopped making new lows which is being reflected in the downward trend for oil prices. While the past decade or so has trained investors to dive back in to the commodity cyclicals once yields turn higher the clear winners from the next recovery period will likely depend on the direction of the U.S. dollar. Commodity cyclicals or consumer cyclicals?

Equity/Bond Markets
Above we showed the relationship between the dollar and crude oil prices. We wanted to expand on the energy price trend somewhat on this page.
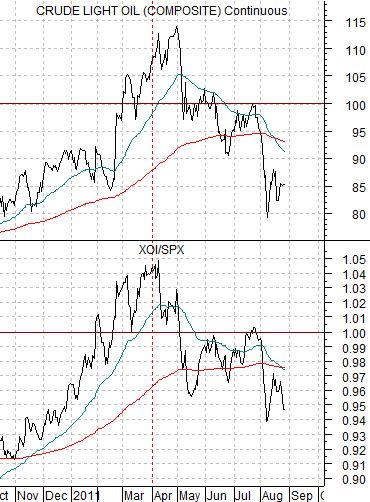
Next is a chart of crude oil futures and the ratio between the Amex Oil Index and the S&P 500 Index. We have argued in past issues that any time the XOI/SPX ratio rises above 1:1 the price of crude oil is ‘fair’ north of 100.
While crude oil prices may have peaked at the end of April concurrent with the last bottom for the dollar the peak for the XOI/SPX ratio was actually made around the end of the first quarter. In other words we are now close to 5 months into a correction or bearish trend for the energy sector.
The second point is that the oil stocks tend to lead oil prices. One might think that oil prices rise and then the oil stocks follow but it has been our experience that it tends to be the other way around.
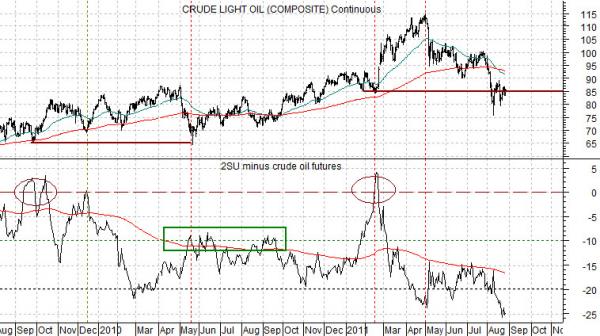
In any event… the chart below compares crude oil with the spread between 2 times the share price of Suncor (SU) and crude oil futures.
The idea is that SU tends to trade around one half of the price of crude oil. When the spread falls to -20 it tends to suggest that oil stock price weakness is forecasting lower oil prices. Crude oil price bottoms tend to be made when the spread rises back up to -10 or, in more extreme cases, all the way up to 0.
The chart suggests that the oil stocks are still arguing for lower oil prices. If lower oil prices go with a stronger dollar and a stronger dollar goes with better strength in the consumer cyclicals then our ‘lean’ on a period of recovery has to tilt towards energy and basic materials ‘users’ as opposed to the ‘producers. (i.e. PC instead of FCX).