Given that we have made this argument many times in the past we will summarize it as quickly as possible so that we can move on to our point.
The commodity markets peaked at the start of the 1980’s and then spent close to 20 years wallowing around in a state of investor disregard. Around the end of the 1990’s following the Asian/Russian/Brazilian crises commodity prices hit a cycle bottom. The CRB Index rose nicely into late 2000 before slumping to a second or double bottom into late 2001. From there it was onward and upward.
If 20 years of gloom and doom is required to thoroughly wash out an investment class then the Japanese stock market today is somewhat similar to the CRB Index 10 years ago. The Nikkei peaked in 1990 and has spent the better part of two decades losing the majority of its value.
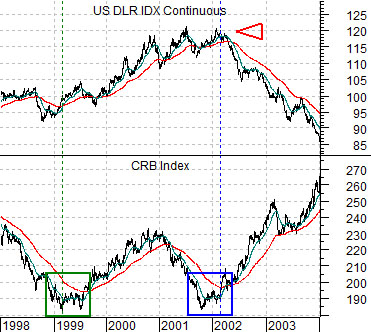
The chart below compares the CRB Index with the U.S. Dollar Index (DXY) futures from 1998 through 2003.
Our first point today is that the CRB Index actually turned higher in early 1999 following 1998’s Asian crisis. The second low into 2001 was a function of a stronger dollar that finally began to decline in early 2002. In other words the trend turned positive in 1999 but it took dollar weakness in 2002 to truly pop the cork for prices.
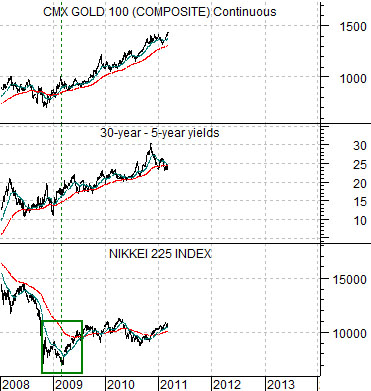
Next is a chart comparison between the Nikkei 225 Index, the spread between 30-year and 5-year Treasury yields, and gold futures.
Our argument is that the Nikkei likely turned positive following 2008’s sub-prime mortgage crisis in a manner similar to the CRB Index in 1999. Similar to the dollar’s impact on the commodity markets there are still a number of forces adding negative pressure to the Nikkei including the rising yen and Swiss franc. For the purposes of this presentation we have decided, however, to use the yield spread and gold prices as a surrogate for the U.S. Dollar Index between 1999 and early 2002.
The second point is that the key to a bullish trend for the Nikkei may well come from weaker gold prices and the kind of upward pressure on short-term interest rates that initiates a flattening of the yield spread. Whether this process creates a double bottom for the Nikkei remains open to question but our sense is that some time over the next few weeks, months, or quarters the Nikkei should start to find some traction as an offset to sustained price weakness for gold.
Equity/Bond Markets
Much of our work of late has focused on the potential for a flattening of the yield curve. Spreads between long-term and shorter-term Treasuries can decline for one of two reasons- either through falling long-term yields or rising short-term yields.
From the perspective of an improving trend for a cyclical market like Japan’s Nikkei 225 Index the best or most bullish outcome would be for short-term yields to rise and one of the ways to show how this might work is through the comparison of 5-year Treasury yields to TBill yields and the Fed funds rate.
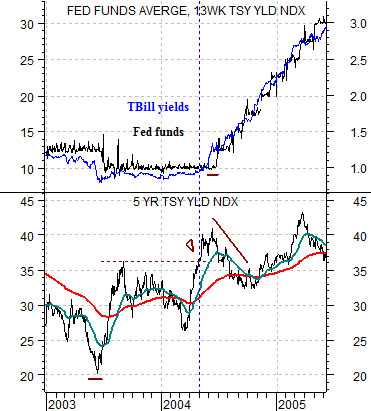
Below is a chart of 5-year Treasury yields and an overlay of U.S. 3-month TBill yields (in blue) and the overnight Fed funds rate (in black) from 2003 into 2005.
The argument is that 5-year yields rise first and at some point in time- possibly as 5-year yields break to new highs similar to April of 2004- we start to see upward pressure on TBill yields followed by a hike in the funds rate.
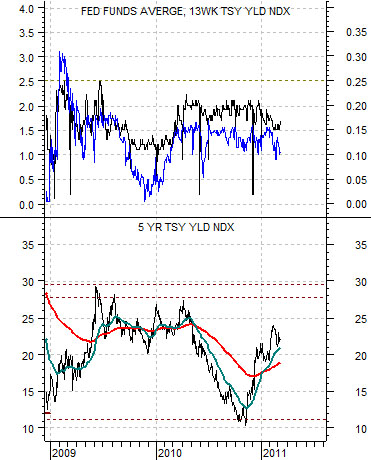
Next is the same chart from the current time frame. The chart suggests that the closer 5-year yields get to 2010’s peak of 2.8% or, perhaps, 2009’s top of 3.0%… the greater the upward pressure will be on TBill yields and the Fed funds rate.
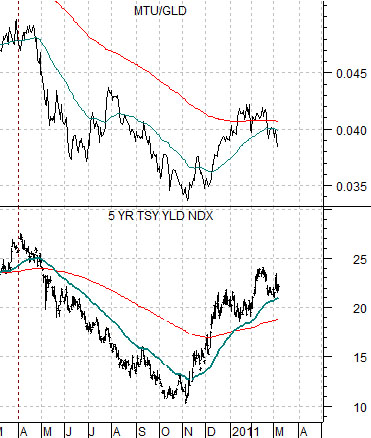
Last is a comparative view of 5-year yields and the ratio between Japanese bank Mitsubishi UFJ (MTU) and the gold etf (GLD). The point here is that the kind of rising trend for 5-year yields that will lead to an eventual hike in the funds rate appears to include upward pressure on the laggard banks (MTU) and downward pressure on gold (GLD). In other words the higher the MTU/GLD ratio rises the closer we should be to a flattening of the yield curve due to upward pressure on short-term yields.