We argued way back in the spring of 2006 that the underlying trend for commodity prices had turned negative. The problem was that commodity prices kept rising. In a sense we were absolutely correct in our view even though we were also completely wrong.
Our view was that the underlying trend had turned bearish and that was actually the case for quite a number of cyclical sectors. We could show, for example, a chart of the CRB Index or crude oil futures and argue quite convincingly that the price collapses during the second half of 2008 was merely a function of a market coming back ‘on trend’.
The point is that when the trend turns negative but prices keep rising eventually the piper is going to have to be paid. Eventually what could have been a fairly minor correction turns into something closer to a complete disaster.
So… why are we mentioning this today? Simply because our sense is that the markets are in the process of diverging from a negative trend.
Below is a chart of the Hang Seng Index from September of 1996 through into January of 1998.
The argument is that the underlying trend turned negative for the Hong Kong stock market at the start of 1997. This was when crude oil prices reached a peak along with the commodity currencies. The chart shows, however, that the Hang Seng Index ‘bubbled’ higher into August of 1997 before ‘crashing’ back on trend into the fourth quarter of the year. This was an early warning sign of problems to come for Asian growth with the actual crisis showing up in earnest around a year later in 1998.
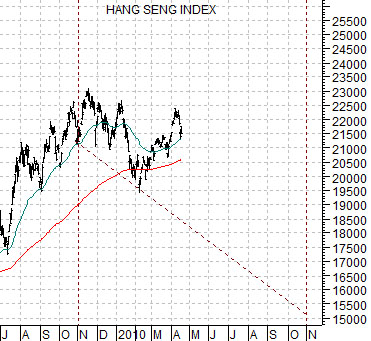
Below is a chart of the Hang Seng Index from the current time period.
Our view is that the underlying trend for the Hang Seng may have turned negative back in November of 2009 when the dollar finally began to rise. If this proves to be correct then the index could drift sideways for a few months or even decline but… given that the markets seem to have developed an affinity for drama… it is possible that we are going to see price strength through the second quarter leading into yet another collapse over the second half of the year.

Equity/Bond Markets
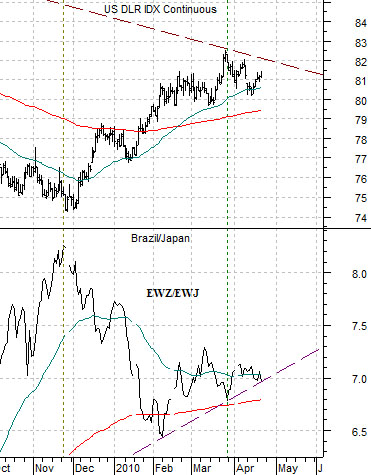
It wasn’t that long ago that most believed that as soon as the dollar started to rise the commodity markets would collapse. The problem this year has been that the dollar has been stronger than the euro even as the commodity currencies have risen against the dollar. The kind of ‘strong dollar’ that acts as a negative for commodity prices typically involves weakness in the commodity currencies (Cdn and Aussie dollars for example).
Below is a comparison between the U.S. Dollar Index (DXY) futures and the ratio between the Brazil and Japan etfs (EWZ/EWJ).
On the one hand the dollar has risen since November of 2009 while the Japanese stock market has outperformed Brazil. On the other hand the Brazil/Japan ratio continues to find support on the rising trend line which suggests that the markets are still trading as if the dollar is working through a minor correction in an ongoing bear trend.
The point? As long as the EWZ/EWJ ratio keeps bouncing off the trend line the commodity/BRIC theme remains intact. Given that the ratio closed right on support yesterday we thought we would feature it today.
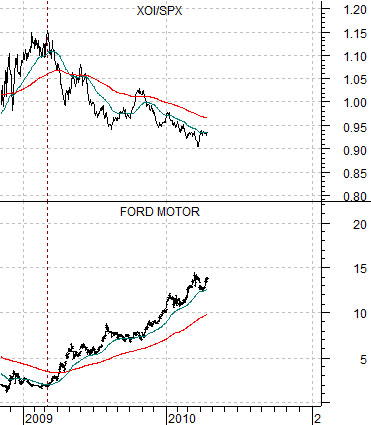
Further below is a comparison between the share price of Ford (F) and the ratio between the Amex Oil Index (XOI) and S&P 500 Index (SPX) from 1996 into late 1999.
The Hang Seng Index (page 1) collapsed in 1997 leading into the Asian crisis of 1998. Obviously any comparison to 1997 (our page 1 point) would appear to a negative for the U.S. equity markets. However… that really wasn’t the case. In fact the autos and airlines were very strong through that time frame with Ford’s share price tripling from around 12 to above 35. The offset to a falling XOI/SPX ratio can take the form of price strength for the autos and airlines… except, we suppose, for those time periods that include major volcanic eruptions.