We are going to do something fairly imaginative today. We use the term ‘imaginative’ because the chart comparison at right is both macro in nature as well as something of a stretch. Still, we thought it might be worth the effort.
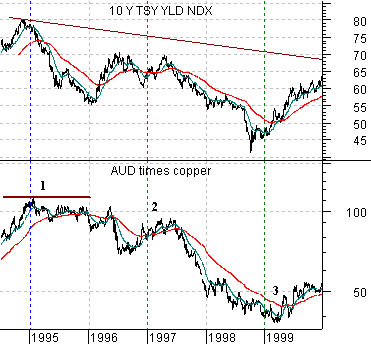
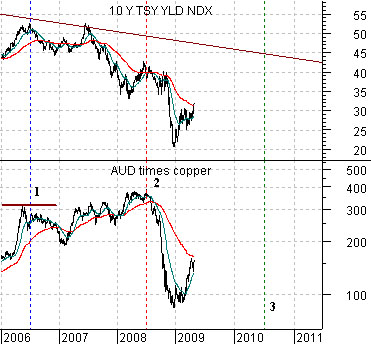
Beloware two charts of the yield index for 10-year U.S. Treasuries (TNX) and the product of the Australian dollar (AUD) futures times copper futures. The top chart starts in mid-1994 and runs for 5 1/2 years through 1999 while the lower chart covers the time frame from the beginning of 2006 to the present day.
In general… long-term Treasury yields, the Aussie dollar, and copper pries are part of the same trend because they represent different aspects of cyclical growth. Strong economic activity will tend to push base metals prices, interest rates, and the commodity currencies higher.
The argument revolves around the series of markets crises that began in the autumn of 1998 running through into the first quarter of 1999. These crises did not occur right ‘out of the blue’ but instead were the end result of many years of capital outflows and cyclical weakness.
10-year yields peaked around the end of 1994 and ultimately bottomed in late 1998. The cyclical correction began around the end of 1994 as copper prices and the Aussie dollar reached a peak. Interestingly enough… crude oil prices did not turn lower until the start of 1997 so there was a 2-year time period through 1995 and 1996 when yields were falling along with base metals prices and the Aussie dollar even as crude oil prices remained strong.
We have shown on a number of occasions and in a variety of ways that the cyclical peak for the recent cycle took place back in 2006 so we begin the comparison using the 2006 peak for 10-year yields as our ‘anchor’.
If history were to repeat then crude oil prices would remain strong for another two years which would mark mid-2008 as the start of oil price weakness. So far… so good because that is exactly when oil prices topped out and collapsed. If the cycle is going to follow a similar path to 1995-99 then the ultimate low for interest rates, the commodity currencies, base metals prices, and energy prices would be due some time around the middle of 2010 which suggests that there are still a few shoes left undropped in the commodities sector.
Equity/Bond Markets
We have to lay our cards on the table. We have a rather huge markets-related bias. This bias has, is, and will color our conclusions and views. The charts are invariably correct so the mistakes that we make are based on our interpretation of what the charts are ‘saying’ and to the extent that we hold a bias almost everything that we present is going to be skewed in one direction.
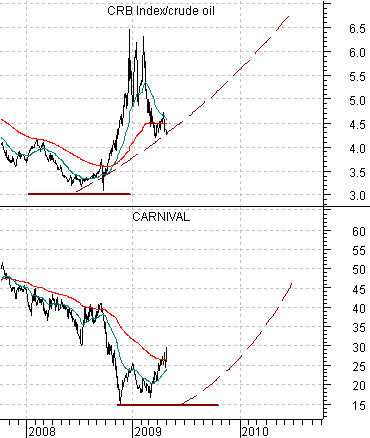
The bias is, of course, that the cyclical theme involving commodity prices in general and crude oil prices in particular will remain weak well into 2010. Fair enough.
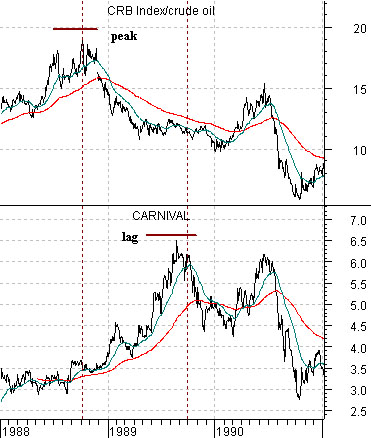
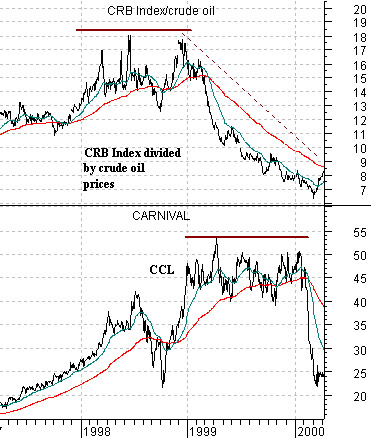
Belowwe show two charts of Carnival Cruise Lines (CCL) and the ratio between the CRB Index and crude oil. The top chart is from 1988 into 1990 while the lower chart is from 1997 into 2000.
The argument is that the CRB Index/crude oil ratio goes with the share price of Carnival but leads at the turns by close to a year. In other words when the CRB Index/crude oil ratio peaked in both 1989 and 1998 it meant that a year or so later the stock price of CCL would top out and turn lower. A peak for the CRB Index/crude oil ratio marks the point in time when oil prices reach their bottom relative to general commodity prices and since CCL is a major energy ‘user’ a return to relative strength by energy prices is an eventual negative.
The logical leap that we take from this argument would be that it works in both directions. If the peak for the CRB Index/crude oil ratio leads the highs for CCL then the process should work much the same way when the ratio bottoms. Our view- one that we have shown in these pages with some regularity- is that the CRB Index/crude oil ratio made a major cycle low in 2008. If that proves to be the case then the argument was that CCL (representing a broader theme which includes airlines and autos) should be making a major cycle bottom this year.