Let’s cut to the chase. If the equity markets are going to continue to hold or rally then our view is that the heavy lifting is going to have to come from the tech and health care sectors. Probably with help in due course from the energy ‘users’ (i.e. autos and airlines).
In fact… if there is a theme for today’s issue… it probably has something to do with ‘banks versus oils’ or, perhaps, ‘banks versus natural gas stocks’.
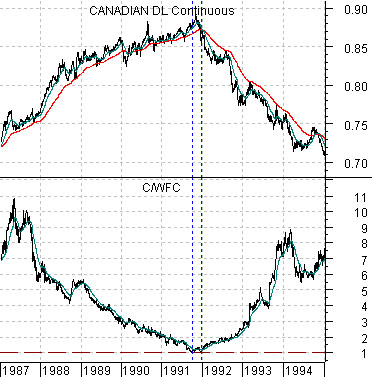
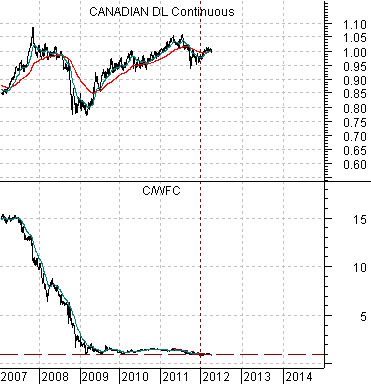
First is a chart of the Canadian dollar (CAD) futures and the ratio between the share price of Citigroup (C) and Wells Fargo (WFC) from 1987 through 1994.
We showed this chart in yesterday’s issue but wanted to expand somewhat on our perception of the implications for the current market.
The ‘decade theme’ argues that certain trends keep repeating from one decade to the next. The problem is that the differences in the repetition are just enough to mask the fact that we keep doing the same things over and over again.
The C/WFC ratio represents laggard versus leading banks. In other words Wells Fargo seems to keep on plugging away while Citigroup goes boom and bust. The ratio declines during periods of stress and rises when economic growth has recovered far enough and long enough.
The ratio peaked in 1987 and then again in 2007. The ratio bottomed towards the end of 1991 which led to our view last year that the low point for the cyclical trend would be passed as we moved out of the fourth quarter of 2011. So far, so good.
The ratio appears to trend inversely to the Canadian dollar so as it turns higher the commodity currencies should begin to weaken. We have included another spin on this on page 7 by substituting the ratio between the Bank Index (BKX) and Natural Gas Index (XNG) for the C/WFC ratio.
The point? The argument would that the next major trend change will include weakness in energy prices and/or strength in the banking stocks. One can measure or follow along with the progress of the trend change by watching the Canadian dollar future.
Equity/Bond Markets
Our view is that the oil and gas stocks are going to have a difficult summer leading to a fairly significant price bottom around the month of October. Strangely enough natural gas prices are unlikely to recovery until crude oil prices fall significantly. Why? Because as long as oil prices remain ‘high’ there is an incentive to drill for oil. Which makes sense. The problem is that natural gas is often discovered at the same time which compounds the oversupply problem.
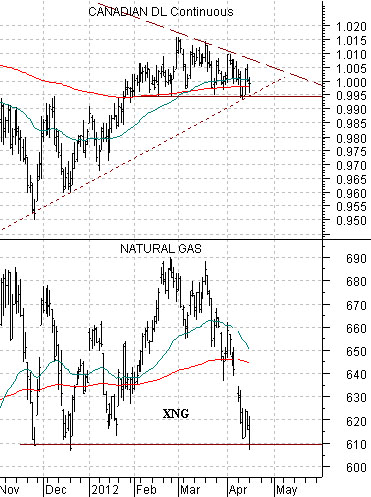
Next is a chart of the Canadian dollar (CAD) futures and the Natural Gas Index (XNG). We have argued that the relationship is very ‘tight’. The weaker the XNG the greater the pressure on the Cdn dollar.
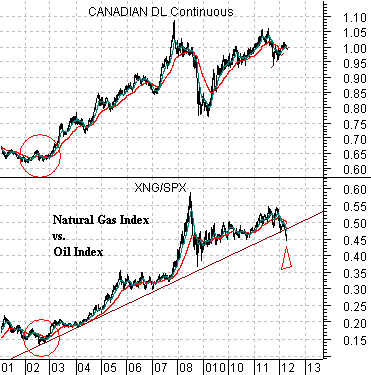
Below is another view using the CAD futures and the ratio between the Natural Gas Index and the S&P 500 Index (XNG/SPX).
Our argument has been that the positive trend for the natural gas stocks began in 2002 as the U.S. dollar started to decline. If we run a support line up under the XNG/SPX ratio… it is fairly easy to suggest that a significant change in trend occurred earlier this year.
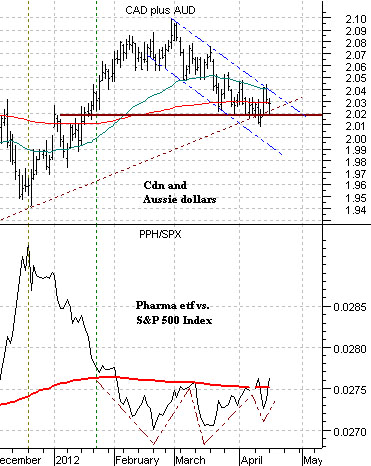
Below is a view of the sum of the Canadian and Australian dollar futures (CAD plus AUD) and the ratio between the pharma etf (PPH) and S&P 500 Index (SPX).
The drug stocks are on the ‘other side’ of the cyclical trend from the commodity cyclicals. The Cdn and Aussie dollars trend with the commodity cyclicals and tend to do better with a weaker U.S. dollar and rising interest rates. The pharma stocks, on the other hand, outperform when the U.S. dollar is stronger as well as when interest rates are declining.
We have reduced the entire picture into this comparison. The stronger the PPH/SPX ratio the greater the downward pressure on the commodity currencies. The dividing line for a short to intermediate-term trend change is usually found around the 200-day e.m.a. line.