The question today is… at what level will rising crude oil prices crater the equity markets?
The premise, we suppose, is that recessions are supposed to change trends. When we get a recession and the trend fails to change… then there is a reasonable chance of another recession (and another) until the trend finally shifts. The trend into 2008 was based on emerging markets growth, strong commodity prices, and ultimately very strong energy prices. The basic trend from early 2009 to the present day has been driven by emerging markets growth, strong commodity prices, and, to a some extent, rising energy prices. In other words the markets melt down in 2008 served to correct the trend but it failed to alter the trend.
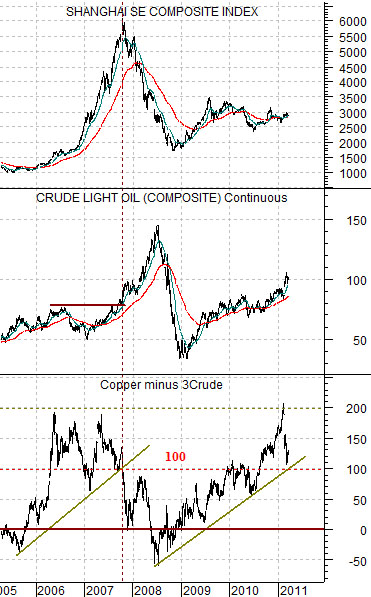
Below is a chart of the Shanghai Composite Index, crude oil futures, and the spread or difference between copper futures (in cents) and (three times) crude oil futures (in dollars).
The argument is that over time the spread between copper (in cents) and crude oil (times 3 in dollars) tends to swing up and down through the ‘0’ line. When the spread is rising it represents a positive trend for the Asian growth theme.
To put this into some kind of context let’s take another run at it. Through an economic cycle copper and crude oil prices will tend to rise in tandem but strong copper is a positive while strong crude oil is a negative. As long as copper prices are rising faster than crude oil the spread will move upwards while the late-cycle ‘catch up’ for crude oil prices will turn the trend somewhat negative.
In 2007 the Shanghai Comp. peaked as crude oil futures prices broke to new highs. This coincided with the copper minus crude oil spread breaking down below ‘100’.
Our thought is that while crude oil futures moving above 100 has proved to be a problem we should move concerned about what might happen to the growth trend if the spread were to decline below the ‘100’ level. With copper at, say, 4.27 (427) this would mean that if crude oil prices were to rise above 109 (3 times 109 equals 327) then we should seriously start to look for indications of cracks in the rising trend.
Equity/Bond Markets
Now… we are going to toss yet another two-handed argument into the mix. With apologies.
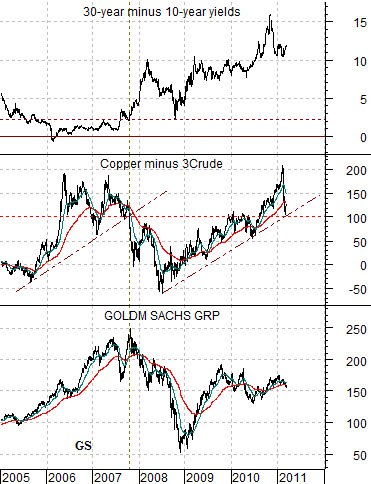
Below is a comparison between Goldman Sachs (GS), the spread between copper and crude oil, and the yield spread between 30-year and 10-year yields.
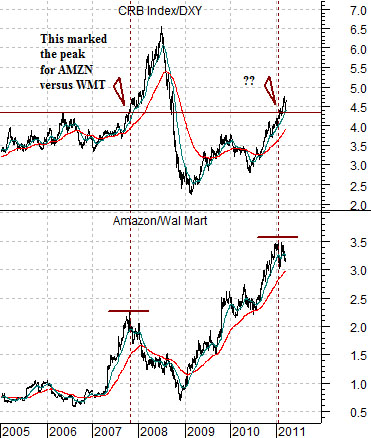
Next we show the ratio between the CRB Index and the U.S. Dollar Index (CRB/DXY) and the ratio between Amazon (AMZN) and Wal Mart (WMT).
The share price of Goldman Sachs tracked quite closely with the Shanghai Comp. so we are using it instead of Chinese equities. As well the peak for both GS and the Shanghai Comp. in late 2007 went with the cycle peak for the Amazon/Wal Mart ratio.
On the one hand… Goldman Sachs’ chart looks less than impressive to date and the ratio between Amazon and WMT is making a potential top as the copper minus crude oil spread tumbles. Definitely reasons for concern.
On the other hand… the yield spread was ‘low’ in 2007 as years of monetary tightening slowed growth. That is definitely a reason for optimism today as the yield spread is both ‘high’ and economically stimulative.
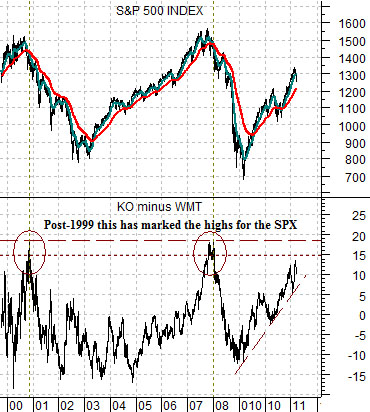
If we had a third hand… we would use it point to the chart below. The chart suggests that in both 2000 and 2007 the price spread between Coke (KO) and Wal Mart (WMT) rose to move than ‘15’ and that this marked the start of the last two equity bear markets.
The point? If the trend continues to drive off of dollar weakness then we are perhaps much closer to its end than we had previously assumed.