At the end of last week we introduced the argument that price peaks for crude oil have tended to occur when the ratio between crude oil and the CRB Index rises above .30. In other words for any given level of the CRB Index the price of crude oil has tended to be ‘high’ when it exceeds 30% of the index.
We are going to expand somewhat on this topic as we look at the three prior instances when the crude oil/CRB Index ratio moved above .30. The first occurrence took place through the middle of 2008.
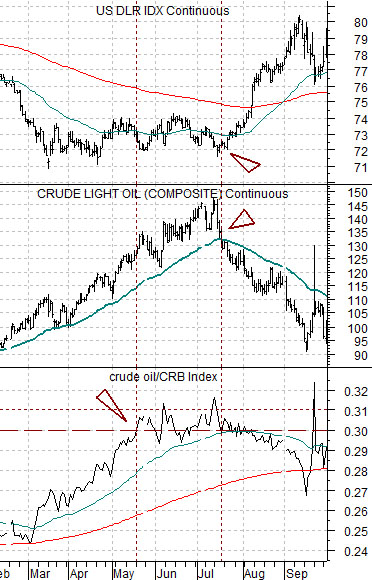
Below is a chart of, from bottom to top, the crude oil/CRB Index ratio, crude oil futures, and the U.S. Dollar Index (DXY) futures from February 2008 through September of that year.
The first point would be that the ratio rose above .30 in the general time frame for an oil price top. The second point is that there is quite a difference between the ‘general time frame’ and the exact price peak. The ratio trended above .30 in May about two months ahead of the final top for oil prices.
The next point is that the shift from bullish to bearish trend for crude oil was made in July once the price declined down through the 50-day exponential moving average. Our thought is that while break of this moving average line won’t catch the actual price peak it may help to identify when the trend has actually changed.
Finally, after the ratio between crude oil and the CRB Index moved above .30 to indicate an impending price peak followed a couple of months later by a decline through the moving average line to confirm the trend shift… the U.S. dollar began to rise.
If we put this all together we come up with something of a template that may help with the current situation. When the ratio rises above .30 the energy trend is approaching some sort of top. When crude oil prices snap back through the moving average line the trend has changed from bullish to bearish. This should go with or be confirmed by some kind of upward acceleration in the dollar.
Equity/Bond Markets
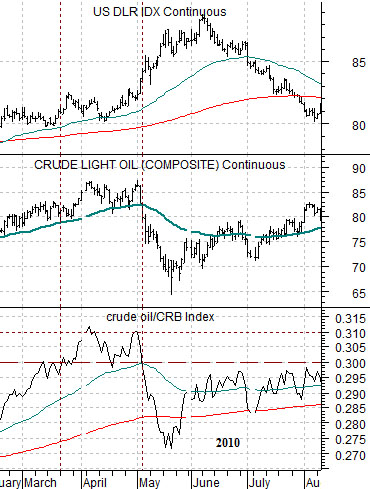
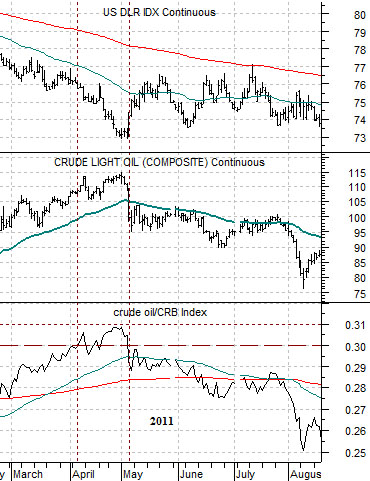
Below is the comparison between the crude oil/CRB Index ratio, crude oil futures, and the U.S. Dollar Index futures from 2010. Below right we have included the same chart from earlier this year.
The crude oil/CRB Index ratio moved above .30 in March of 2010 a few weeks before the peak for crude oil prices. Crude oil broke below the 50-day e.m.a. line in early May. While this did not capture the lows for the U.S. Dollar Index we can see that the dollar accelerated upwards as oil prices tumbled.
The chart below shows the third instance when the ratio eclipsed the .30 level. In this case the ratio moved to a top in April while the U.S. dollar was trending lower. The price of crude topped out towards the end of the month with the break through the moving average line going with a somewhat less dramatic upward pivot for the U.S. dollar.
We are going to show the current situation on page 5 today. The template that we are using suggests that there can be a period ranging from a couple of weeks out to a couple of months between the ratio extending through .30 and the break down through the moving average line and upward pivot for the dollar. On the other hand… we also note that the lag appears to be getting shorter each time we work through this sequence.
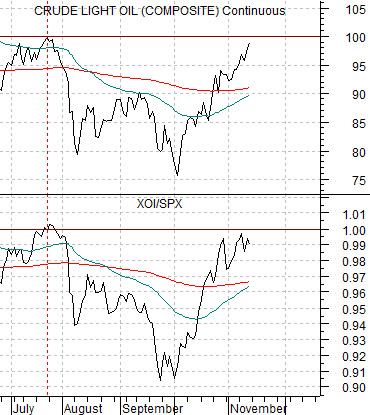
Below is a view of crude oil futures and the ratio between the Amex Oil Index (XOI) and the S&P 500 Index (SPX).
The argument is that when the XOI/SPX ratio rises above 1:1 the price of crude oil will tend to be above 100. The one small detail perhaps worth noting from the end of last week was the dip in the XOI/SPX ratio as it approached 1.00. This suggests at least the possibility that crude oil futures prices are going to run into resistance at or just below triple digits.