When the equity markets make a major cycle bottom and turn higher there comes a time when rising prices move into a period of consolidation. This is often the result of a combination of a peak for cyclical asset prices combined with rising short-term or long-term yields.
The first serious correction for the equity markets following the 2000- 2002 bear market took place in 2004 while the U.S. stock market moved lower for much of 1984 following the 1981- 82 bearish cycle.
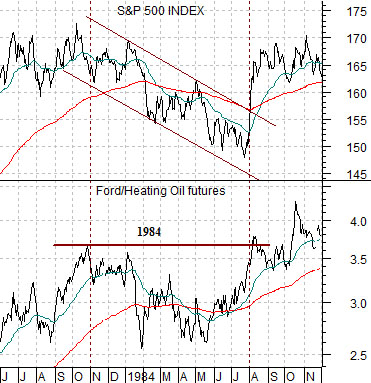
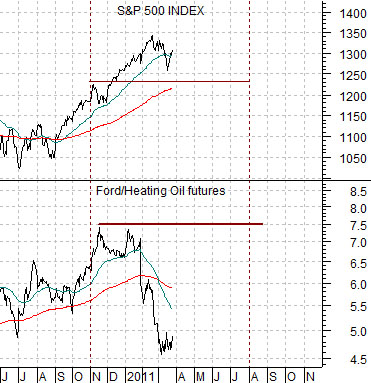
Below is a chart of the S&P 500 Index (SPX) and the ratio between Ford (F) and heating oil futures from June of 1983 through into November of 1984.
We argued a few years back that the stock market’s trend would turn positive once the ratio between Ford and heating oil futures started to rise. The ratio eventually bottomed in November of 2008 about four months ahead of the March 2009 lows for the S&P 500 Index.
The argument was based on the way the markets resolved coming out of the 1981- 82 ‘bear’. The share price of Ford started to rise relative to energy prices well in advance of the stock market’s bottom and as long as the ratio was climbing the broad stock market continued to push.
The chart shows that the ratio rose to a peak in October of 1983. After declining into the spring of 1984 the ratio began to rise once again until it was very close to new highs in late July of that year. The broad stock market, which had been grinding lower for 9 or 10 months, shifted from bearish to bullish in the a veritable blink of an eye.
Below we show the same comparison from the current time frame. Notice that the chart begins in June of 2000 in the same manner that the top chart runs from June of 1983.
The issue, we suppose, is that a case could be made that the S&P 500 Index could easily be much lower than its present levels. If the index had turned lower when the Ford/heating oil ratio topped out in January then something closer to 1150 would appear quite reasonable. Whether the market can continue rise simply through a weaker dollar and rising commodity prices is a difficult question… especially now that the Aussie dollar has rebounded quickly back into its previous resistance level (page 3).
Equity/Bond Markets
We are not sure whether this is an inspired piece of thinking or a simple fixation on a potential coincidence but… we thought we would take another run at it just in case.
It has to do with the month of March in the ‘1’ year of a new decade. As premises go this one may be a bit of a stretch.
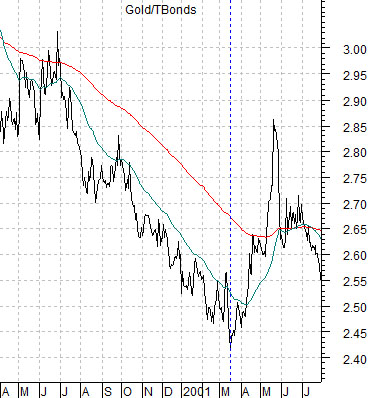
The chart at just below shows the ratio between gold prices and the price of the U.S. 30-year T-Bond futures. The argument in yesterday’s issue was that the price of gold relative to long-term bonds peaked in 1980, declined for 20 years, and then rose for the next ten years back to the original peak. In other words as bond prices trended upwards for the past 30 years gold prices weakened on a relative basis for 20 years and then shot back up to the original extreme through the last decade.
In any event the low point for the ratio was reached in March of 2001. After two decades of declining gold prices fell to a major and perhaps generational relative strength bottom in March of 2001.
Fast forward ten years and we are now in the month of March in 2011.
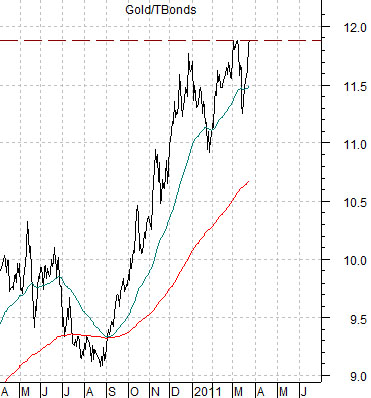
Next we show the same ratio to make the point that the gold/TBond ratio has risen to its highest level since 1980 when it spent a mere four trading days north of 12:1 before collapsing lower.
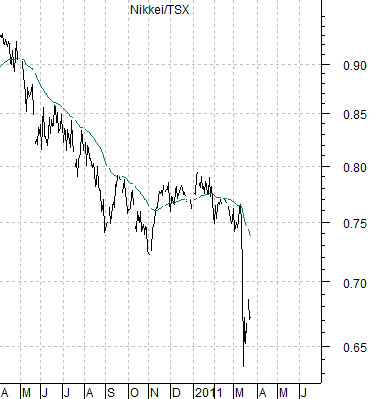
The offset to the peak in the gold/TBonds ratio may well be the ratio between the Nikkei 225 Index and Canada’s S&P/TSX Composite Index. The chart below right shows that the Nikkei made a post-earthquake low relative to Canadian stocks this month. The arguments are that IF the gold/TBond ratio is at a peak- perhaps for years or even decades- then the Nikkei/TSX ratio could potentially have made a generational bottom.