Nov. 4 (Bloomberg) — Stocks surged, sending the MSCI World Index to a two-year high, and commodities rallied after the Federal Reserve announced plans for more bond purchases and earnings beat analyst estimates. The dollar sank and two- and five-year Treasury yields touched record lows.
Our basic view for some time has been that the cyclical trend will remain strong through the end of the year. So far, so good.
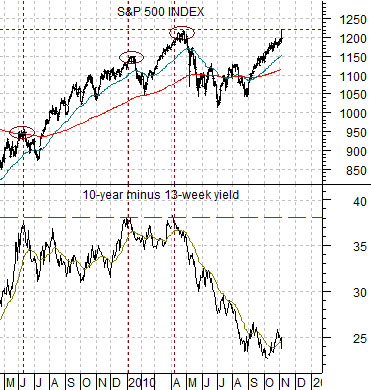
Immediately below is a comparison between the S&P 500 Index (SPX) and the spread or difference between 10-year and 3-month U.S. Treasury yields.
The argument is that the spread tends to peak around 3.8%. Given near-0% TBill yields this allows 10-year yields to drift up to around 4.0% before reaching serious resistance.
When the spread has risen to 3.8% the S&P 500 Index has tended to be at a peak. The chart shows a quick correction in June of last year followed by another in January of this year and a third in April.
The point is that if the spread has to rise back to 3.8% to mark the next equity markets top… that will take some doing. It will also take at least a few months to accomplish given the downward pressure exerted by the new round of quantitative easing on longer-term yields.
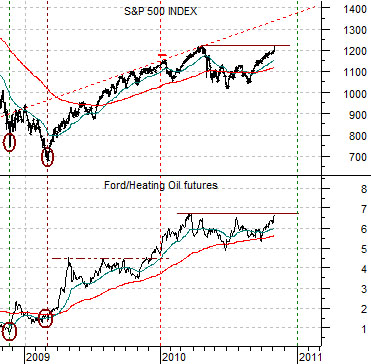
Next we show the SPX and the ratio between Ford (F) and heating oil futures.
We have argued for the past couple of years that the recovery trend for the broad stock market should follow the Ford/heating oil ratio. With the benefit of hindsight… this has definitely worked out nicely.
With the SPX back to the April peak yesterday the next order of business is how high the index can rise if it manages to shake clear of the 1220 level. Our thought is that if the Ford/heating oil ratio manages to make new highs in the days to come then the SPX has the potential to take a run at the 1350- 75 range before the quarter draws to a close.
Equity/Bond Markets
We usually use this segment to focus on the equity markets but we are going to shift gears somewhat so that we can show a comparison anchored by the trend for copper prices.
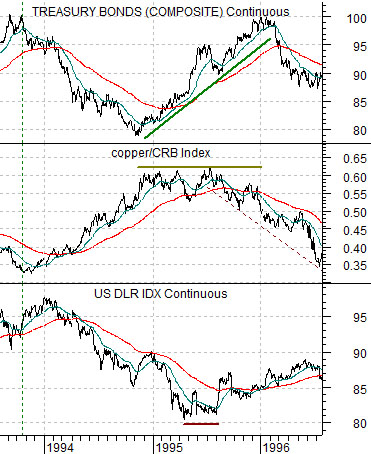
Just below is a chart of the U.S. 30-year T-Bond futures, the ratio between copper and the CRB Index, and the U.S. Dollar Index (DXY) futures from 1993- 96.
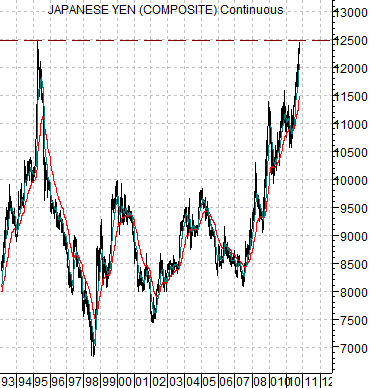
To put this into quick perspective take a look at the chart below of the Japanese yen futures. The yen reached a peak in August of 1995 around the 125 level. This is the same level that the currency is stressing at present so our argument is that there are certain similarities between what was going on in mid-1995 and the present time period.
The dollar turned lower in early 1994 which helped lift copper prices. The copper/CRB Index ratio rose as bond prices fell. When the copper/CRB Index ratio finally reached a peak in early 1995 the bond market stopped declining and started to trend back to the upside.
While the copper/CRB Index ratio held below the peak levels set at the start of 1995 the bond market continued to push upwards. Eventually the yen peaked which set a bottom for the dollar. Dollar strength pulled the copper/CRB Index ratio downwards validating the rising trend for bond prices. Meanwhile… equity prices were trending higher.
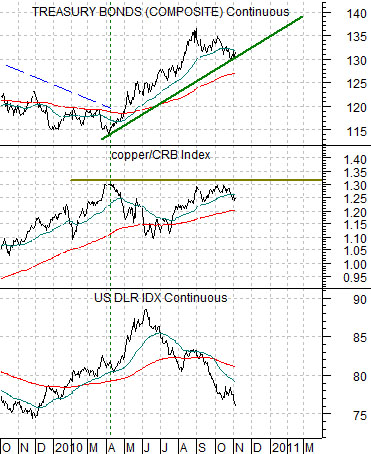
In the current situation the bond market pivoted upwards as soon as the copper/CRB Index ratio reached a peak in April. The initial decline in the ratio was met by renewed dollar weakness which helped it to move back to- but not above- the highs. This has helped support the rising trend for the TBonds.
One of the near-term risks might be serious yen weakness which would help support the dollar and lower the copper/CRB Index ratio. New highs for this ratio, on the other hand, would turn the trend for bond prices lower.