The problem with the Fed’s statement that it is going to hold interest rates at extraordinarily low levels into 2013 is that it effectively pulls 2-year Treasury yields down towards 0%. Let’s take a quick look at the relationship between 2-year T-Note futures prices and the S&P 500 Index.
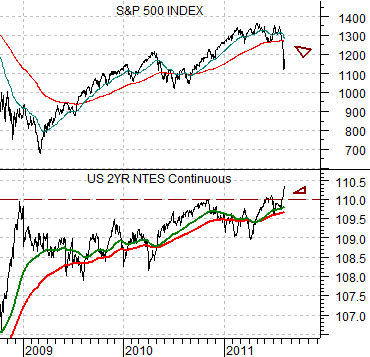
Below we show the comparison from the end of 1998 to the present time period. The argument is that any time the 2-year T-Note futures are trending higher the SPX is trending lower.
Next we show the chart over a somewhat shorter time frame. The idea is that when the 2-year T-Notes began to push above the price peak set at the end of 2008 the S&P 500 Index started to melt down. If the Fed’s intention was the prop up the bond market to the detriment of the equity markets then, we suppose, they have been reasonably successful.

Equity/Bond Markets
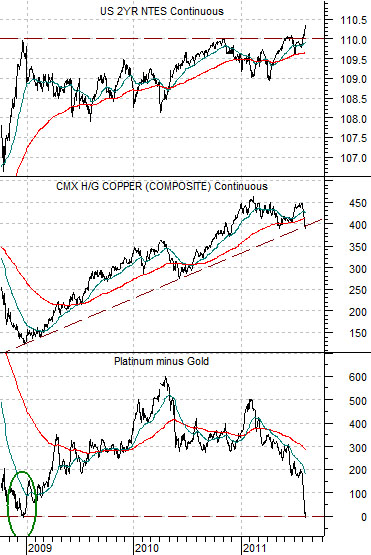
The chart below compares 2-year T-Note futures, copper futures, and the spread or price difference between platinum and gold futures.
The absolute bottom for the cyclical trend at the end of 2008 was marked by a decline for platinum prices down to the level of gold prices. In other words when the spread between platinum and gold prices fell to ‘0’ the 2-year T-Note futures peaked in price while copper prices bottomed and turned higher.
Earlier this year platinum futures prices were as much as 500 higher than gold but as the trend has weakened the spread has narrowed until, last seen, gold is trading slightly above platinum while copper prices flirt with the rising support line.
The upside break by the 2-year T-Notes suggests that the markets are preparing for the worst with copper prices breaking support and the spread between gold and platinum falling to new lows. We are not going to argue that this is how things have to play out but if we take the bond market’s message literally… we are heading down the rabbit hole.
We have taken issue with the inevitability of this particular outcome. We try not to argue with the bond market but, from time to time, we simply can’t resist the urge. So, here goes.
Our view was that 2011 is not the same as 2008. Our view has been that crude oil prices were ‘the problem’ in 2008 while gold is ‘the problem’ this year.
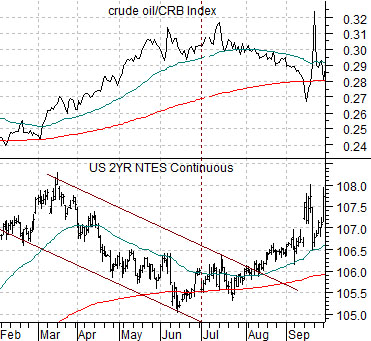
At bottom we show U.S. 2-year T-Note futures and the ratio between crude oil and the CRB Index from 2008. Notice how the peak for the crude oil/CRB Index ratio around mid-year sent bond prices higher.
Below is a chart of the 2-year T-Note futures and the ratio between gold and the CRB Index. Instead of negative pressure on bond prices as an offset to strong oil prices we have upward pressure on bond prices as an offset to strong gold prices. Our logic is that if the equity markets trend lower when bond prices trend higher… then weakness in the gold/CRB Index ratio will pull bond prices back to the down side to the benefit of the equity markets and cyclical trend.