From time to time we argue that it is getting close to the point in time when the Federal Reserve will start to raise the Fed funds target rate. We thought we would ‘snug’ this argument up just a bit to show that while a case can be made… the markets have yet to reach the point where a rate hike is imminent.
Our first point is that the first Fed funds rate increase is typically a positive while the same can be written of the second, the third, the fourth, etc. It isn’t the first interest rate increase that is bearish but rather the last. If the markets collapse following a single short-term interest rate increase then in theory the first could prove to be the last but in general it takes some time to push short-term interest rates from the bottom back up to a cycle top.
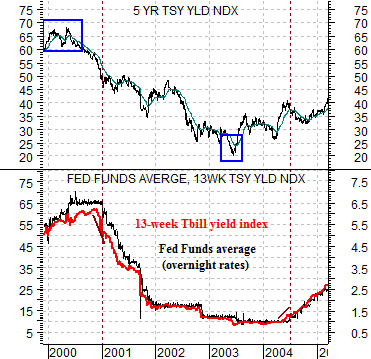
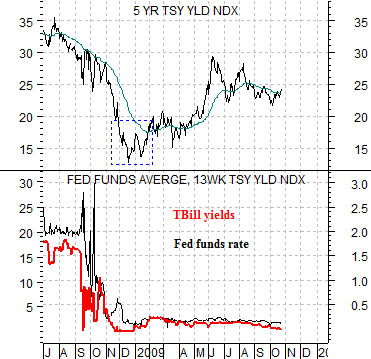
At top right is a comparison between 5-year Treasury yields and an overlaid chart of the Fed funds rate (black line) and 3-month or 13-week Treasury bill yields.
The second point is that the funds rate and TBill yields track very closely together. The funds rate is a one-day or overnight interest rate while TBill yields represent the interest rate for 3 months.
The third point is that far in advance of a change in Fed policy the long end of the bond market will change direction. 5-year Treasury yields peaked and turned lower in early 2000 while the Fed did not begin to chop the funds rate until January of 2001. The low point for 5-year yields was reached in 2003 close to a year in advance of the Fed’s first funds rate increase in mid-2004.
The fourth point is that the Fed does not lead the markets and apparently it is also loathe to surprise the markets. While difficult to see on a long-term chart a month or so in advance of the Fed rate decrease in January of 2001 TBill yields started to tumble. Ahead of the 2004 Fed rate increase TBill yields had already begun to rise.
In summary… the rising trend for 5-year Treasury yields since December of 2008 suggests at least the potential for a higher Fed funds rate but the one detail that is still missing is an increase in TBill yields. Until TBill yields climb back above the funds rate along with clear price deterioration in 3-month eurodollar futures the markets- which lead the Fed- are still arguing that there is almost no chance of an imminent change in Fed policy.
Equity/Bond Markets
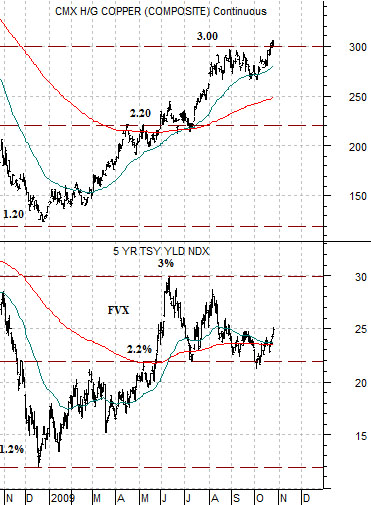
At top right is a comparative view of copper futures and 5-year U.S. Treasury yields (FVX).
The argument over the past year or so has been that copper futures PRICES have held quite closely to 5-year Treasury YIELDS. The chart shows, for example, that when copper prices fell towards 1.20 in December yields declined to 1.2%. The first rally for yields back to 2.2% went with copper prices rising to 2.20 and then when yields spiked up to 3.0% it eventually led to a grind up to 3.00 for copper futures.
The first point is that if copper prices escape above 3.00- as appeared to be the case early in trading yesterday- the relationship would pull long-term Treasury yields up to new recovery highs. An intraday rally in the dollar helped to cool the rise of commodity prices with copper closing the session around 2.98.
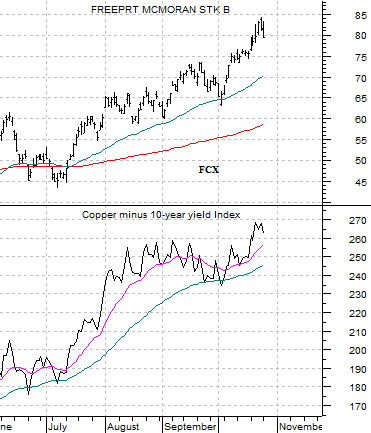
Below right is a comparison between FreePort McMoRan (FCX) and the spread or difference between copper futures and 10-year Treasury yields. The second point is that rising copper prices without a corresponding increase in interest rates- as has been the case since early June- pushes the share price of FCX upwards. As long as copper prices are rising faster than yields the mining stocks tend to do nicely.
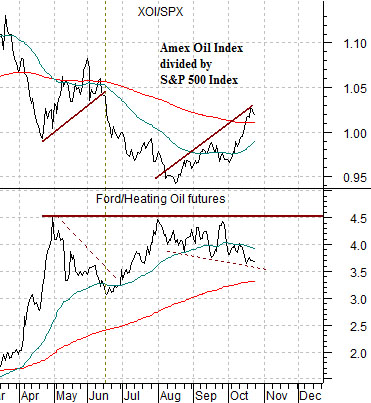
Below is a comparison between the ratio of the Amex Oil Index (XOI) to the S&P 500 Index (SPX) and the ratio between Ford (F) and heating oil futures.
The rather complicated argument can be distilled into a simple premise: when the oils are ‘strong’ the Ford/heating oil ratio tends to decline. One of our views this year has been that the Ford/heating oil ratio would rise as the markets recovered. The problem has been that strength in energy prices through May and again between August and October has kept the Ford/heating oil ratio from making new highs. Ideally the XOI/SPX ratio starts to decline allowing the markets to rotate back to the energy ‘users’ through the balance of the quarter.