We actually do follow at least some of ‘the news’. We are aware that Japan intervened to weaken the yen, that China’s currency rose to new highs against the dollar, and that U.S. energy inventories declined. Each of these is important in its own right and may impact a variety of markets in the days to come but we have other fish to fry and issues to fixate over so we will blindly push on in our usual manner.
The two intermarket details that have our focus these days are the ‘2-year lag’ and the ‘decade theme’. The 2-year lag argues that the cyclical trend lags behind changes in interest rates by two years while the decade theme suggests that at the start of each decade one or more key markets reaches a ‘bubble’ peak.
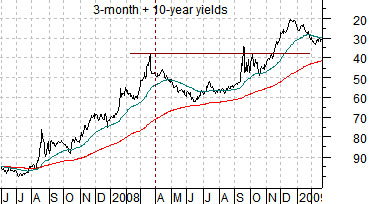
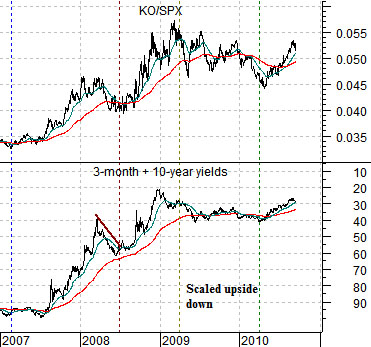
Below we show an upside down chart of the sum of 3-month and 10-year Treasury yields. Scaled in this manner the direction of the price trend reflects the movement of ‘prices’ instead of ‘yields’. A rising line means higher prices while a falling line means lower prices.
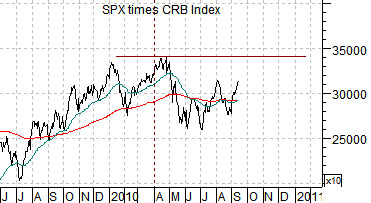
Below this is a chart of the product of the S&P 500 Index (SPX) times the CRB Index (equities times commodities). The yields chart runs from June of 2007 into early 2009 while the equities times commodities chart starts two years later in June of 2009.
The argument- once again- is that we are in the midst of a positive cyclical trend that began back in 2009 and is expected to run through the balance of the year. The ‘pause’ for equities and commodities through the second quarter of this year can be explained by the ‘pause’ in the rising trend on the upside-down yields chart during 2008.
The problem is that equities relate to the bond market on two different time frames. In the here and now equities have tended to decline in response to falling yields. The 2-year lag, however, suggests that falling yields will lead to stronger cyclical asset prices two years from now.
The chart below compares the sum of 3-month and 10-year Treasury yields with the ratio between Coca Cola (KO) and the S&P 500 Index.
In real time the share price of Coke has outperformed the broad market by a considerable margin since mid-2007 in response to a decline in short and long-term yields. While rising yields may not push KO’s share price lower on an absolute basis the argument is that it will lead to pressure on a relative basis.
You might think that it would be easy to ‘spot the bubble’ but the markets are rarely that simple. In a world where gold prices rising to all time record new highs is explained away as investors seeking to reduce risk… almost anything is indeed possible.
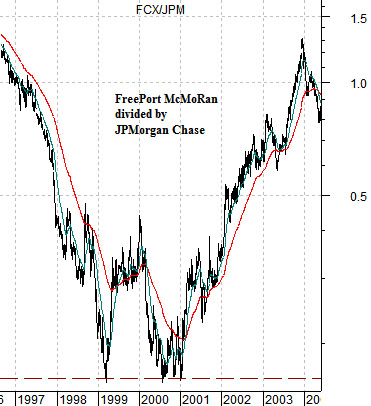
Let’s try to put this into perspective. Most are aware that the Nasdaq reached a ‘bubble’ peak in 2000. What might not be so obvious is that this was less the trend than the result of the trend. In other words the Nasdaq was a an effect instead of a cause.
Below is a chart of the ratio between copper miner FreePort McMoRan (FCX) and JPMorgan Chase (JPM) from 1996 into 2004. The ‘bubble’ into 2000 was actually in large cap financial assets as opposed to small cap, foreign, and raw materials prices. When the trend changed in late 2000 it ushered in a bear market for the S&P 500 Index while initiating a bull market in real asset prices.
Our point? Our sense is that we will see cycle peaks in long-term bond prices, gold prices, the commodity currencies, and Swiss franc later this year- price peaks that won’t be challenged for years to come. The decade theme argues that one or more major asset classes tend to peak in the first year of a new decade and our ‘bet’ is that it will be bonds and gold this time around.
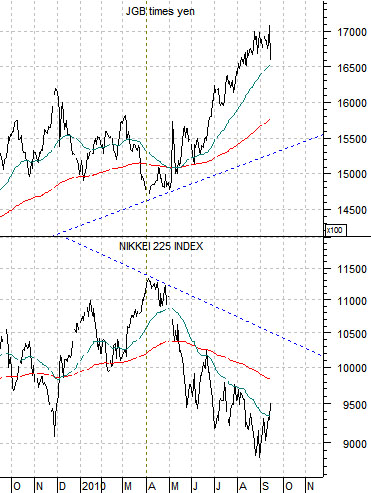
Below we show the Nikkei 225 Index and the combination of the Japanese 10-year (JGB) bond futures times the Japanese yen. Yen and bond price weakness yesterday helped confirm the recent strength in the Nikkei. Our thought is that the Nikkei this year may be similar to the FCX/JPM ratio in 2000…
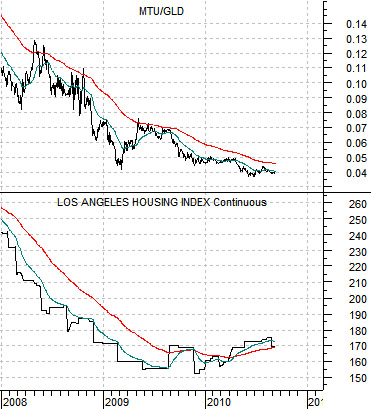
Quickly… the ratio between Japanese bank Mitsubishi UFJ (MTU) and the gold etf (GLD) is shown below along with Los Angeles Housing Index futures. The simple point is that stronger banks and weaker gold go with a recovery in U.S. home prices.