
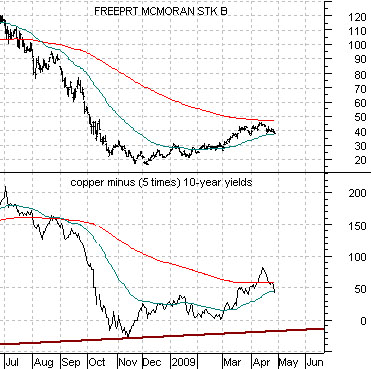
We are going to start things off today by showing an example of two of how the markets work through a cyclically strong trend.Below we show the chart for FreePort McMoRan (FCX) along with the chart of copper futures prices minus (5 times) 10-year yields.
In general… during a period of rising cyclical strength… we will see stronger copper prices and higher long-term interest rates. We have argued in these pages in the past that an explanation for the share price rise for copper producer FCX would be that copper prices were pushing higher at a faster pace than yields.
A few weeks back copper was trading around 2.20 (220) while 10-year yields were closer to 2.75% (27.5) which pushed the spread up to around 82. At the same time FCX was trading around 46. Today copper is under 2.00, yields are pushing 3.00%, the spread is well under 50, and FCX has fallen back into the 38’s.
The point was that as long as copper prices were rising faster than 10-year yields the trend for FCX would remain positive but once copper prices started to struggle, and especially if yields continued to rise, the trend would cool. Fair enough.
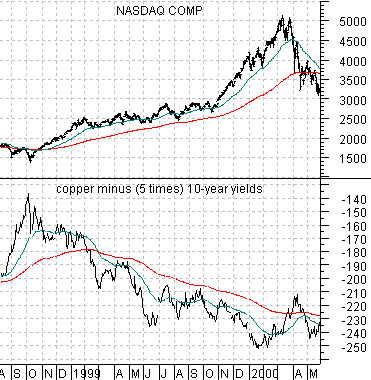
The actual point that we wanted to make today is shown through the chart below. The chart compares the Nasdaq Composite Index with the copper futures minus 10-year yields spread from August of 1998 into May of 2000.
While we have and will argue that ‘cyclical is cyclical’ there are times when one sector will dominate. In other words during a positive cyclical trend you will tend to find Asian stocks, base metals and energy prices, tech, and even the commodity currencies, autos, and airlines on the rise. On occasion, however, one or more of these sectors will remain weak generally because one or more of these sectors is overly strong.
From 1998 into 2000 the copper minus yields spread declined. In other words for close to a year and a half copper prices were weaker than yields which meant that the intermarket back drop for the mining stocks was generally negative. One can argue that base metals price weakness helped concentrate the flow of money into the tech and telecom sectors or argue that the Nasdaq’s momentum was so great that it drew money from most other sectors. Either way this is an example of a ‘focused’ cyclical growth trend.
Around the end of February and into early March our argument was that the equity markets should rally for very close to two months from March into May. When the trend finally turned positive on March 9th the argument was that the rally would extend to very close to the middle of May. Since we are only approaching the end of April… our view is that there could still be a couple of more weeks of better price action for the S&P 500 Index.
The problem is that a rising trend for the S&P 500 Index requires a ‘driver’ of sorts. One or more sectors at any given time have to do the heavy lifting so that prices in general continue to rise and as one sector after another has reached its 200-day e.m.a. line the SPX has begun to struggle somewhat. The idea was that the SPX would make a reasonable run at the 950 level but recently it has begun to stall out close to 850.
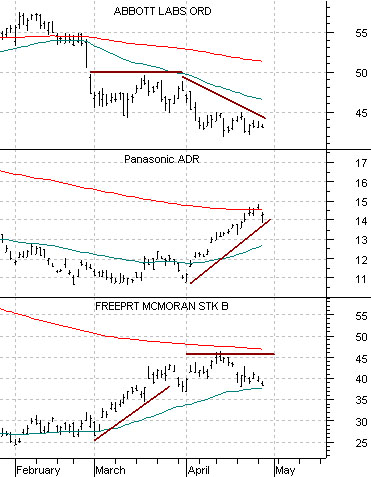
Belowwe show a comparison between Abbott Labs (ABT), Panasonic (PC), and FreePort McMoRan (FCX). ABT is a defensive growth stock, PC is a consumer cyclical, while FCX is a commodity-based cyclical.
As FCX pushed upwards in March PC held flat and ABT declined. Once FCX flattened out around the end of March PC swung higher and ABT… declined once again. Our sense is that when the consumer cyclicals start to flatten out the trend may shift back towards the stable growth theme represented by the share price of ABT.
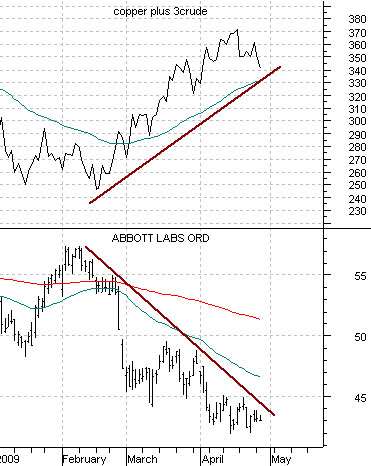
ABT- chart below – tends to be pressured lower when base metal and energy prices are stronger so continued weakness in crude oil and copper would be a positive.
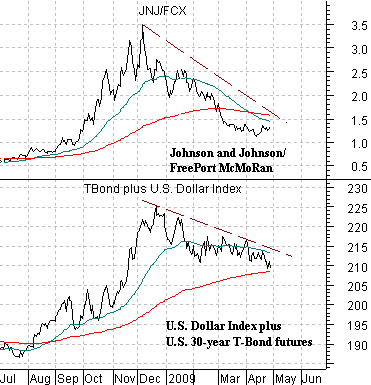
To really kick the consumer growth theme back into gear, however, we would need to see either a stronger dollar, a stronger bond market, or- ideally- both stronger at the same time. When the sum of the DXY and the TBonds is on the rise then the share price of Johnson and Johnson (JNJ) will tend to rise relative to FCX.
Equity/Bond Markets

