April 1 (Bloomberg) – The yen traded near a three-week low versus the dollar after posting its biggest quarterly loss since 2001 before a Bank of Japan survey forecast to show sentiment among manufacturers fell to the lowest in more than 30 years.
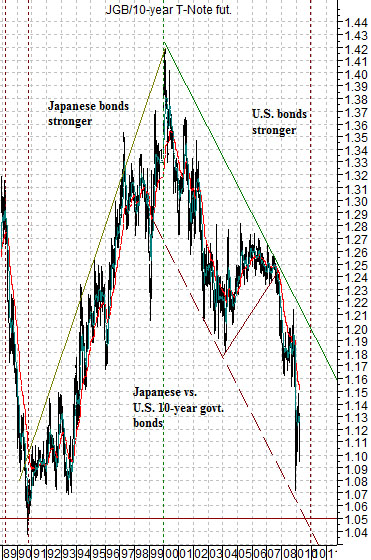
March 31 (Bloomberg) – Japan’s 10-year bonds fell, completing the first quarterly decline since June…At right we have included a chart of the ratio between 10-year Japanese and U.S. government bond futures.
On a day-to-day basis the markets throw up so much smoke and dust that it is almost impossible to see the bigger picture so today we thought we would start things off with a macro perspective.
The chart shows that from 1990 through 1999 the basic trend included relative strength by the Japanese bond market. In other words Japanese bond prices were stronger because Japan’s economy was weaker. Fair enough.
From 2000 into 2009 the trend reversed as U.S. bond prices pushed upwards relative to Japanese bonds. The argument is that a divergence was created during the 1990’s as Japanese interest rates declined relative to U.S. interest rates and that one of the major driving forces within the markets over the past decade has been the narrowing of this divergence as U.S. yields have been pulled down towards the levels of Japanese yields. Once again… fair enough.
The two thoughts that come to mind are as follows. First, while many worry about the imminent prospect of hyper-inflation the bond market’s action suggests that we have spent the last nine or so years inexorably working towards deflation. Second, if sub-2.0% yields represent a deflationary environment then ‘how’ the ratio completes its final squeeze lower is going to be important. 10-year Japanese yields are 1.34% and rising while U.S. yields are 2.69% and falling. If they manage to meet in the middle north of 2% then we should see a return to rising asset prices but if the end game occurs south of 2% then we could be looking at an extended period of stagnant global economic growth.
Equity/Bonds Markets
Having introduced the chart of the ratio between 10-year Japanese and U.S. bond futures prices on page 1 we are going to use it as a comparison on this page and again on page 3.
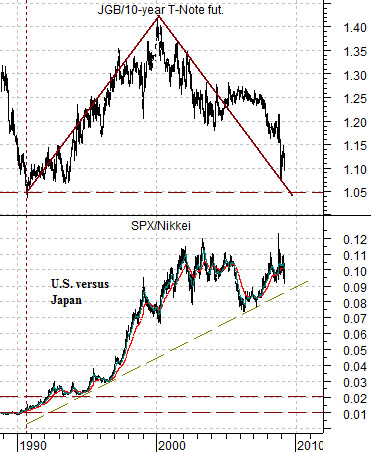
At right we show the ratio between the price of the 10-year Japanese bond futures (JGB) and 10-year U.S. T-Note futures compared against the ratio between the S&P 500 Index and the Nikkei 225 Index.
The argument is that through the 1990’s the Japanese bond market rose relative to the U.S. bond market because Japan’s economic growth and asset prices were weaker. The chart shows that in 1990 the SPX was roughly 1% of the value of the Nikkei and that by 2002 it had risen to something close to 11%.
To put this into some form of perspective the SPX closed yesterday at 798 while the Nikkei was last seen around 8109. At present the SPX is just a bit less than 10% of the value of the Nikkei which means that on a relative basis Japan’s equity markets have declined by something close to 90% against the U.S. markets over the last 20 years.
Our first point is that the inflation/deflation swing point is 2.0% for 10-year government bond yields. Last December 10-year Treasury yields declined to 2.04% as copper futures prices dipped below 1.30 but since then yields have risen as high as 3.05% while copper prices have rallied up above 1.80.
The second point is that one is better off being long the equities of a country with the weaker bond market but only if relative weakness comes from rising yields.
Let’s try that one again. During the 1990’s the U.S. bond market was relatively weaker and the U.S. stock market rose by 10 times against the Japanese stock market. During the 2000’s the Japanese bond market was weaker but only because U.S. yields were falling and not because Japanese yields were rising.
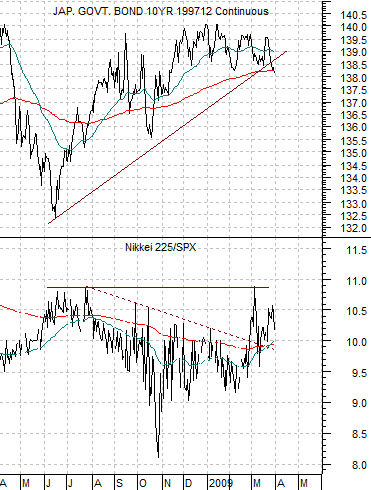
At right we show the 10-year JGB futures and the ratio between the Nikkei 225 Index and the S&P 500 Index.
The argument is and has been (for far too long) that the single most important thing that has to happen to indicate that Japan is coming out of its long period of economic stagnation and asset price malaise is… Japanese 10-year bond prices have to fall so that yields rise back above 2.0%. Yields have risen into the 1.9% range on a few occasions over the past decade but they have never managed to swing up through 2.0% which, of course, makes sense given that Japan has yet to turn the economic corner.
The page 1 argument was that U.S. and Japanese 10-year yields have been converging for most of the past decade. Our point here is that the most bullish outcome for Japanese equity prices would come from a convergence above 2.0%. The chart at right suggests that the weaker the trend for Japanese bond prices the stronger the trend for the Nikkei relative to the SPX.
The idea that we are circling is that we continue to like Japan as a macro theme and believe that the best way to unlock Asian savings and turn it into Asian consumer spending is through rising domestic asset prices. At minimum this has to be confirmed by an upward trend for Japanese 10-year government yields.