It feels as if the markets have been in crisis more often than not for much of the past 15 or so months. Greece seems to come and go with North African and Middle Eastern concerns sprinkled in to keep things interesting. Now the European debt crisis is leaping from country to country on almost a daily basis. Perhaps the lesson in all of this is that the battle between inflation and deflation is simply not ready as of yet to handle central bank tightening. Perhaps the dust will clear once the European Central Bank and Bank of China shift to more accommodative stances.
In any event… the news is dire indeed. Perhaps the best that we can write is that in the face of all of the bad news that has roiled the markets of late the fact that most major equity markets are still trading well above their 200-day exponential moving average lines is somewhere between encouraging and remarkable.
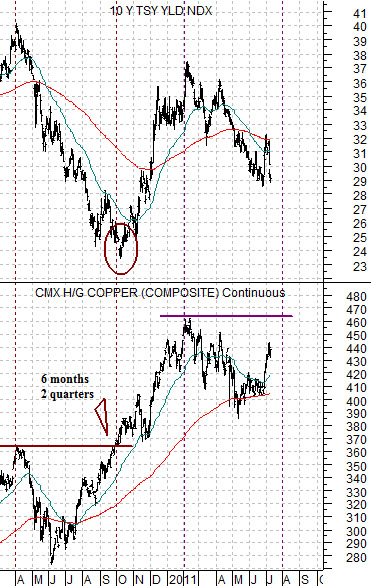
Below is a chart comparing 10-year Treasury yields and copper futures.
It has been our experience that ‘crisis’ markets create wonderful buying opportunities. The twist is that one has to have some kind of sense of where the bottom is because ‘crisis’ markets tend to decline in large chunks over very short periods of time.
The argument is that one measure of the ‘crisis’ trend is represented by falling long-term Treasury yields. As money flees risk-based assets and shaky European bonds it heads to the relative safety of the Treasury market.
Last year’s ‘crisis’ ran out of steam during the third quarter and in sequence the recovery was led by copper futures reaching new highs after a six month consolidation which, in turn, marked the final bottom for 10-year yields.
The thought is that if the markets are inclined to shift almost exponentially towards ‘crisis’ each time growth slows and if copper is working as or representing the cyclical growth theme then the best way to escape from this mess might be for copper to drive up through 4.60 over the next few weeks. Copper at new highs should lead to rising yields which, in turn, would chase money back out of the Treasury market towards more growth-oriented themes.
Equity/Bond Markets
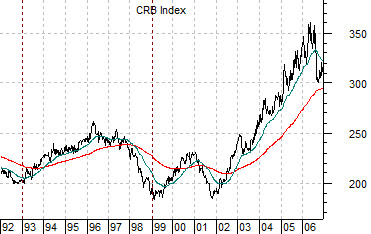
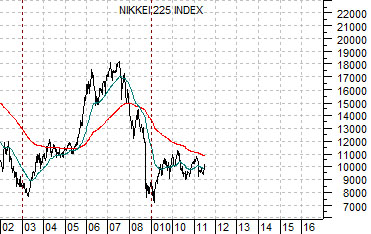
Next is a chart of the CRB Index from 1992 through 2006 and Japan’s Nikkei 225 Index from 2002 to the present day.
We have done this a few times in recent weeks (including yesterday’s issue) but we wanted to take one final run at the argument.
The Nikkei peaked 10 years after the CRB Index so a bottom 10-year after commodity prices might make sense. Given that the CRB Index made its first low in early 1999- equating to the Nikkei’s bottom in early 2009- we like the idea that the Nikkei could be in for a good run this decade.
The problem is… when and from what level? If we take the comparison literally the recovery might not start until the final quarter of this year or, perhaps, the first quarter of 2012. On the other hand… our view is that the CRB Index actually turned positive in 1999 and that the correction through 2001 only served to pull it ‘below trend’ which led to the relentless price rise from 2002 into 2006.
Our thought is that we are long-term bullish and short-term uncertain.
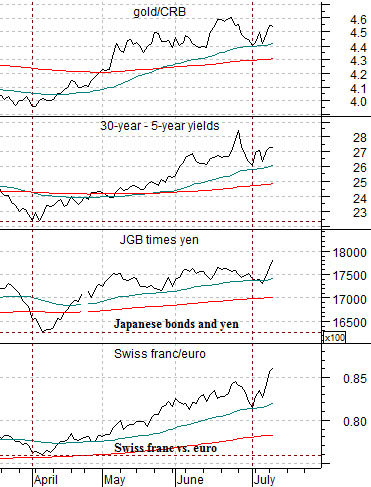
A better trend may require the start of weakness in the various charts shown below right. The gold/CRB Index ratio is still rising as is the spread between 30-year and 5-year Treasury yields. The combination of the Japanese yen times the Japanese 10-year bond futures is making new recovery highs as the Swiss franc/euro cross leaps upwards.
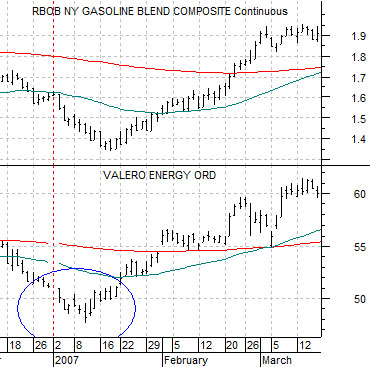
Complicating the issue is the observation that we are now close to half way through the first month of a new quarter. Below is a chart from 2007 of gasoline futures and oil refiner Valero (VLO).
The point is that while trends tend to run quarter to quarter the start of new trends often does not show up for a couple of weeks once a new quarter has begun. One of the strongest trends in 2007 involved rising gasoline prices yet gasoline futures started the year by falling almost daily.