Following the tepid weekly U.S. jobless claims report last Thursday asset prices went into a nose dive. We have been arguing for some time that negative pressure is coming from Europe and Asia while positive pressure reflects gains in U.S. employment.
The problem with the sell off was that it happened within the context of an improving trend. In other words the markets or sectors that had been declining on weakness had stopped making new lows while those moving higher as an offset were no longer making new highs. To us this suggested that for the time being the path of least resistance for asset prices was to the upside.
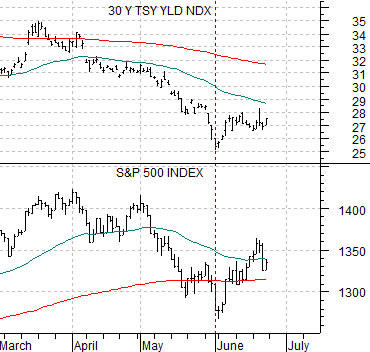
First is a chart comparison between U.S. 30-year Treasury yields and the S&P 500 Index (SPX).
Notice that yields and the SPX bottomed at the end of May and have been working higher this month. If the recovery had truly ended last week then we would have expected to see a considerable decline in long-term yields but all the markets managed to do was move 30-year yields back down to around 2.7%.
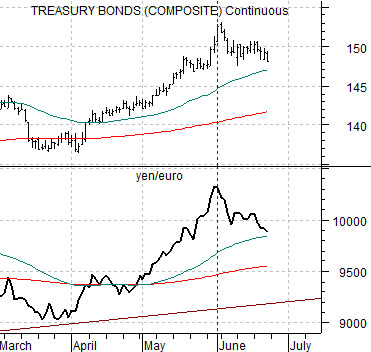
Next is a view of the U.S. 30-year T-Bond futures and the cross rate between the Japanese yen and euro.
When the markets have been under pressure long-term Treasury prices have been forced higher along with the Japanese yen. What was particularly noticeable last week was the lack of strength in both the TBond futures and the Japanese yen. The other side of the argument would be that the euro was not making new lows against both the dollar and yen while gold prices were actually weakening somewhat relative to the CRB Index.
This is a fairly short-term perspective so it might only be good through quarter end or, perhaps, into the heart of next month’s quarterly earnings reports. Our point, however, is that last week’s equity and commodity markets decline was not confirmed by indications of capital fleeing back into the bond market, yen, or gold. Instead it appears very much as if the recovery that began around the end of May is still intact.
Equity/Bond Markets
We read far too often that one should be a buyer of gold stocks because… the gold miners have dramatically underperformed gold prices. Some argue that the best gold price rallies go with gold mining stock outperformance- which is true- but we aren’t convinced that this is relevant in today’s situation.
The question is… what leads and what lags?
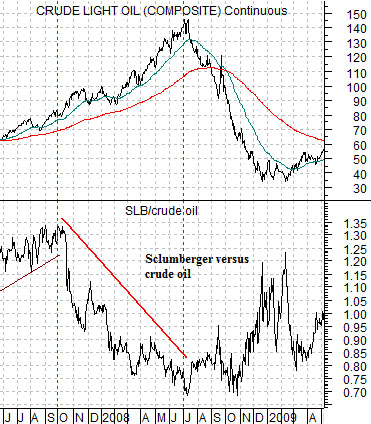
Below is a chart of crude oil and the ratio between oil service company Schlumberger (SLB) to crude oil futures from 2007 into 2009.
The SLB/crude oil ratio declined by almost 50% from 2007 into 2008. Did this mean that one should buy the oil stocks because they had been underperforming oil prices? This would only make sense if commodity prices ‘led’ the equity markets.
Our view is that the markets work the other way around. When the oil stocks start to outperform the broad U.S. large cap stock market the idea is that money is moving towards the energy sector in anticipation of rising oil prices. On any given day one will read that the oil stocks were higher (or lower) in response to stronger (or weaker) oil prices but from a longer-term perspective the equity markets tend to lead.
So… when the SLB/crude oil ratio began to tumble in the autumn of 2007 the message from the markets was that the strength in crude oil prices was unsustainable. Obviously this did not stop crude oil futures from rising from 80 to almost 150 over the next 9 months but eventually prices collapsed.
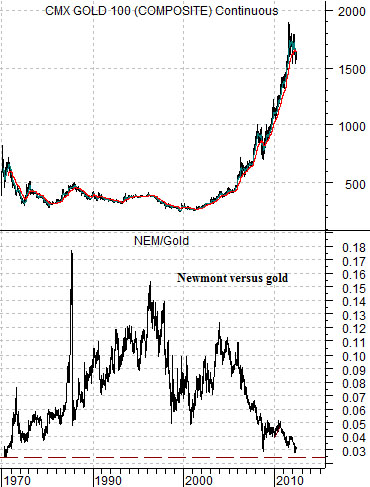
Next is a rather long-term comparison between gold futures and the ratio between the share price of Newmont (NEM) and gold. The chart starts in 1980 and run to the current time period.
The chart covers the last 32 or so years. The only time the share price of Newmont has been lower relative to the price of gold futures was back in 1980.
The NEM/gold ratio bottomed out between May and July in 1980. From there the ratio turned higher only to peak along with copper prices in 1996.
It is true that when the NEM/gold ratio first bottomed out in May of 1980 the share price of NEM was around 12.50. 15 months later NEM had risen to 31 but by mid-1982 it was back to 11.00.
The point? If the equity markets lead then the lower the NEM/gold ratio the greater the down side risk for gold prices. While buying the gold miners might make sense it is more of an equity markets call than a play on gold prices. When the NEM/gold ratio starts to rise part of the gains may come from rising gold mining share prices but there should also be some kind of head wind from declining gold prices.
From our perspective we have little in the way of interest in the metals and mining stocks when the U.S. dollar is rising. Once long-term yields began to track higher we would prefer base metals compared to precious metals (copper outperforms gold when yields are rising).