Question: Why could strong gold prices prove to be a positive for the S&P 500 Index?
While the question might be fairly straight forward the answer requires a bit of an intermarket explanation.
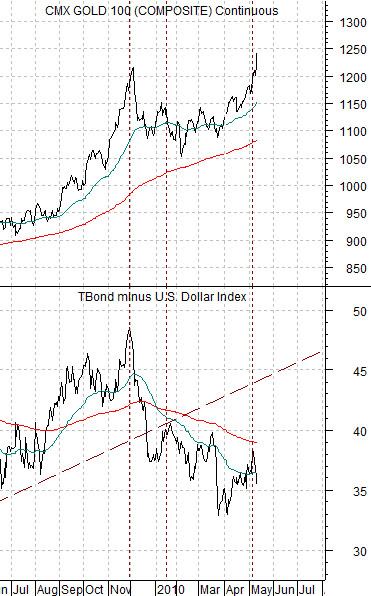
At right is a comparative view of gold futures and the spread between the price of the U.S. 30-year T-Bond futures minus the U.S. Dollar Index (DXY).
As we have explained on many occasions in the past the move positive intermarket back drop for gold involves a weak dollar and rising bond prices. Conversely the most negative situation includes a stronger dollar and falling bond prices.
The chart at right shows that gold prices peaked at the end of last November at the top for the spread between the TBonds and U.S. Dollar Index. It also shows that while the spread has been working lower gold prices have diverged by swinging up to new highs.
Since the dollar remains stronger the key to the divergence lies with the bond market. In other words gold prices have risen from below 1100 up to new highs based on the rally in long-term bond prices that began around the start of the current quarter. The best way to bring a halt to the daily rise in gold prices is for the long end of the bond market to turn lower.
So… the real question is… what would have to happen to push bond prices lower?
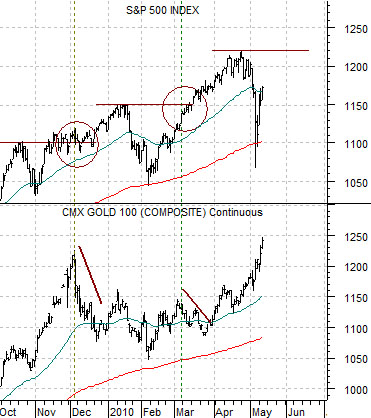
We have argued in recent issues that bond prices should remain fairly flat UNTIL the S&P 500 Index pushes to new highs above 1220. The longer the recovery takes the longer the bond market will remain flat to help support the sharp rise in gold prices.
The answer to our original question is that strong gold prices represent a trend that may run until the S&P 500 Index pushes back to new highs. The longer this takes the further gold prices can move so our sense is that the robust trend for gold prices is actually an indication that the S&P 500 Index is headed up through 1220.

Equity/Bond Markets
Below is a comparison between gold futures and the S&P 500 Index. The argument is that gold and the SPX can rise together- that was most certainly the case in November of 2009 and February of 2010- but tops for gold have tended to occur around the time that the SPX reaches new highs. The reason- we believe- for this is that new highs for the equity markets tend to go with falling bond prices.
At top right is a comparison between the U.S. Dollar Index (DXY) futures and the cross rate between the Canadian and Australian (CAD/AUD) dollar futures.
The dollar has been rising primarily based on weakness in the European currencies. In a sense it is difficult to argue that the dollar is actually ‘strong’ when commodity currencies like the Cdn dollar are making new highs against it.
The twist is that a rising trend for the U.S. dollar tends to go with a rising trend for the cross rate between the Cdn and Aussie dollars. In other words… one way to know that the U.S. dollar is actually in an uptrend is by looking at the upward trend for the CAD/AUD cross rate.
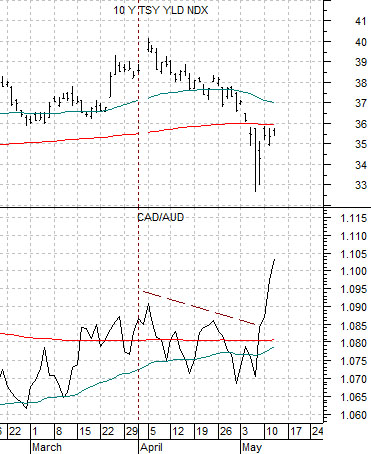
Below right we show 10-year U.S. Treasury yields along with the CAD/AUD cross rate.
The sell off in the S&P 500 Index into early May was likely a delayed reaction to falling long-term yields. Similar to last January the equity markets held near the highs as quarterly earnings were reported and then dumped sharply lower until yields finally reached a bottom.
The point is that there has been a fairly close relationship between 10-year yields and the CAD/AUD cross rate. With the cross rate still rising a case can be made that 10-year yields are going to resolve back up towards 4.0%.


