Market trends are always easier to understand and dissect in hind sight. Give us a couple of years and we will be able to explain exactly what is going in with some amount of clarity. In real time, of course, things are seldom that obvious.
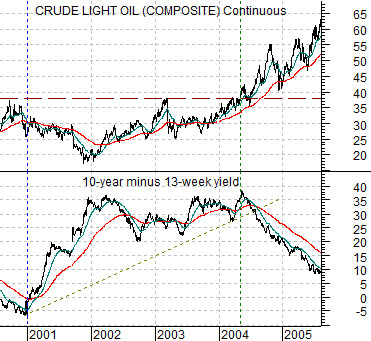
Below is a chart comparison between crude oil futures and the spread between 10-year and 3-month Treasury yields. We will use this as our jumping off point today.
In late 2000 the cyclical trend started to turn negative and in response the yield spread began to widen. The yield curve shifted from inversion in late 2000 (i.e. short-term yields higher than long-term yields) out to a spread of roughly 2.5% to almost 4.0% from 2002 into 2004.
The time period from 2001 into 2004 represented a trend based on economic ‘slack’. The damage created by the post-Nasdaq bubble stretched on into 2004. At this time crude oil futures broke to new all time highs and in response the markets trend changed drastically. The chart shows that as oil prices moved above roughly 38 the spread between 10-year and 3-month Treasury yields began to decline. Interest rate sensitive sectors like lumber started to weaken followed in due course by the home builders and then housing prices. The yield spread continued lower until it once again reached inversion in 2007.
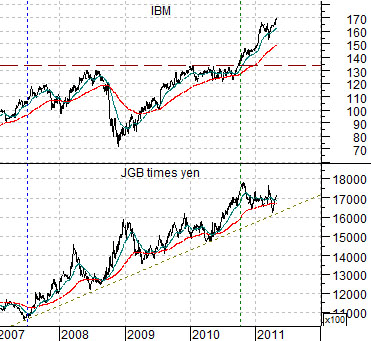
Below is a chart of IBM and the Japanese 10-year (JGB) bond futures times the Japanese yen futures.
When the yield spread inverted in 2007 the trend for the U.S. banks turned negative. The offset to this was a stronger yen and Japanese bond market. Similar to the rise in the yield spread from 2001 into 2004 the trend has basically reflected economic ‘slack’.
The trend shifted from ‘weak’ to ‘strong’ in 2004 in response to new highs for oil prices. Is the current situation similar or should we be looking at something outside of the commodity markets? One thought is that the break to new all time highs for IBM late last year may have represented a game-changing trend shift. What is missing- so far- is any actual weakness in the Japanese yen although we will quickly show on page 5 that this could begin at almost any time.
Equity/Bond Markets
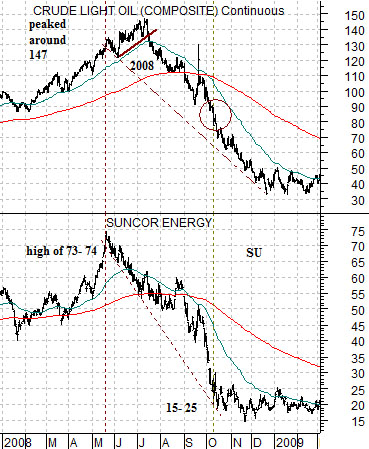
We touched on the argument that the share price of Suncor (SU) is ‘saying’ that crude oil futures should decline to around 85 in yesterday’s issue. We tend to throw quite a bit against the wall but this is likely important enough to actually spend a few minutes explaining.
To start with we have included a chart of crude oil futures and the share price of Suncor from 2008 and into early 2009 at top right.
The argument is that SU tends to trade around one half of the price of crude oil.
Our premise is that most equity markets participants view the markets backwards. They buy oil stocks because oil prices are rising without understanding that the oil stocks are actually leading energy prices. This is not a major issue through the bulk of the trend, of course, as both rise are rising in tandem but it does create problems as the cycle comes to an end.
In late 2008 we had a conversation with a money manager who has been in the business for around 30 years. He complained that his oil stocks had been impossible to sell earlier in the year because they had been falling even as crude oil prices had moved to new highs. If you believe that equities follow commodities… this makes sense. If you grasp the idea that commodities often follow equities… then the weakness in the oil stocks was a fairly clear message that something negative was taking place in the energy complex.
In any event… back to our point. Suncor peaked in price between 73 and 74 in May of 2008. If SU tends to trade around 50% of the price of crude oil then an argument could be made that crude would top out around 146 to 148. Which, of course, it did two months later.
Suncor collapsed down to the 15- 25 range in October of 2008 while crude oil futures were still trading closer to 80- 90. Suncor was ‘saying’ that crude oil would be better in the 30- 50 price range. A couple of months later crude oil had flattened out between 30 and 50.
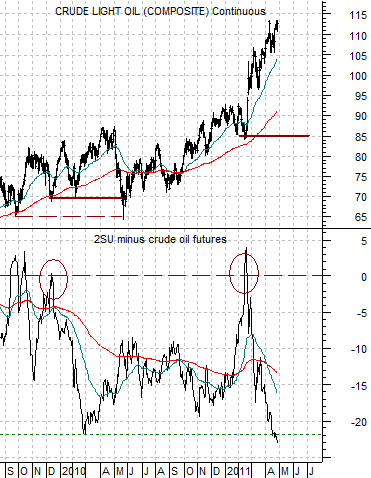
We took this argument and distilled it into the chart at bottom right. This chart compares crude oil futures with the spread or difference between 2 times the share price of Suncor and crude oil futures.
The idea here is that when the spread rises up to ‘0’ and then tumbles it means that the equity market is taking issue in some way with the trend for crude oil prices. In late 2009 the spread rose to or above the ‘0’ line before falling back below -20 into March of 2010. It took a bit of time but eventually crude oil futures prices broke back down to the levels last seen when the spread was at ‘0’
When we apply this argument to the current situation we can see that the spread rose to ‘0’ when crude oil prices were around 85 and that similar to early 2010 the spread has moved rather sharply lower. Our thought is that the further the spread declines (it fell to more than -33 into early July 2008) the greater the eventual pressure on oil prices.
Given that oil prices lag the equity markets we are not arguing that crude oil futures have to decline immediately but based on this somewhat simplistic relationship we mentioned in passing yesterday that we thought that oil prices could move back to around the 85 level.