Aug. 26 (Bloomberg) — Gold and silver futures fell as the dollar’s rebound reduced the appeal of commodities as alternative investments… Bullion for immediate delivery rose $1.18 to $945.93 at 3:27 p.m. New York time.
We thought we would start things off today with a confusing snippet from a Bloomberg article. The headline trumpeted that gold prices had fallen based on dollar strength even as it noted in passing that gold prices ended the session higher.
Our point has nothing to do with the accuracy or veracity of the report even though we could note that gold futures contracts from August of 2009 through August of 2010 did close ‘green’ yesterday. Instead we wanted to show that if gold prices do not decline on dollar strength then there is a good chance that the dollar has yet to truly turn higher. In other words on any given day the dollar can rise or fall but for it to be meaningful those markets that trend with or against the dollar have to respond accordingly. If they don’t then nothing much of importance has transpired.
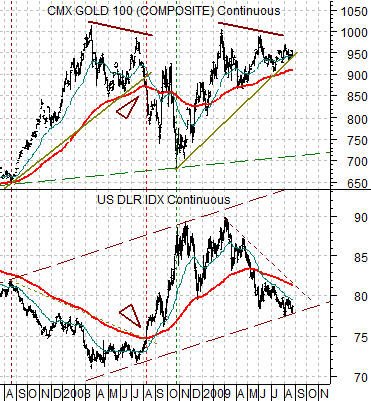
At top right we feature a chart comparison between gold futures and the U.S. Dollar Index (DXY) futures from the summer of 2007 through to the current time frame.
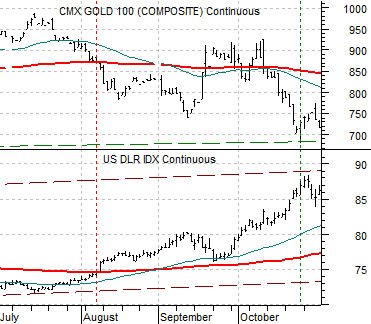
The chart detail that we wished to point out occurred in August of last year. To put this into better perspective we have added a shorter-term view of the relationship covering the time period from July of 2008 through October at bottom right.
On the very day that the U.S. Dollar Index futures broke UP through the 200-day exponential moving average line… gold futures broke down through its 200-day exponential moving average line. The point here is that if the dollar is getting ready to press higher then it should be met by gold price weakness so that by the time the DXY gets into the 81- 82 range the price of gold will have backed down to closer to 910.
Our thought is that on any given day the dollar can rise or fall but dollar strength only becomes meaningful if is translates through into offsetting gold price weakness. Such was not the case yesterday.
Equity/Bond Markets
Above we fixated on the details regarding the dollar and gold prices. We are doing quite a bit of fixating these days as the markets grind through into a potential theme change.
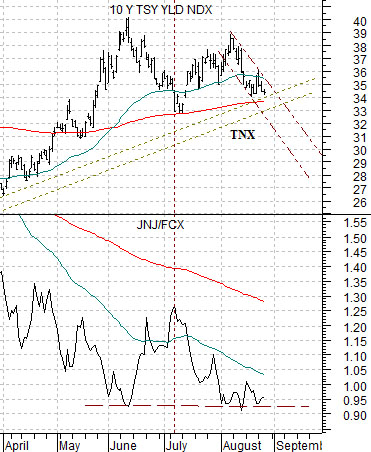
At right we return to a chart that we have shown quite often over the past number of months. The chart compares 10-year Treasury yields (TNX) with the ratio between the share price of Johnson and Johnson (JNJ) and copper producer FreePort McMoRan (FCX).
This is one of the perspectives that supports our contention that while we have not been clearly right at least we have not been overwhelmingly wrong. We can show examples of how the latter could be true- and will do so further down on this page- but for now we will stick with the idea that the markets are in the process of making a decision.
The thesis was that the first half of the year would include rising 10-year yields and favor the commodity sector with an emphasis on a positive energy theme. That has been the tendency through the first two quarters of the year since 2006.
If we turn out to be correct then the June peak for 10-year Treasury yields will hold and yields will slide lower through into the winter. This should be confirmed by relative price action in the equity markets which is a complicated way of writing that the JNJ/FCX ratio should hold the June lows and resolve back to the upside.
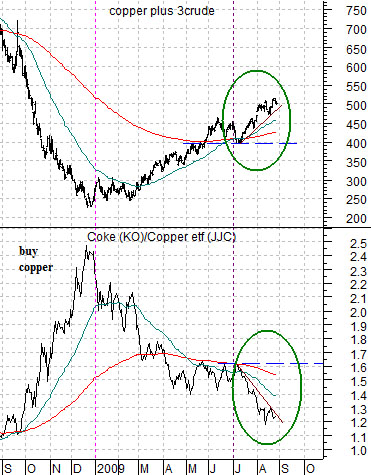
Below right we compare the sum of copper (in cents) and crude oil futures (in dollars times three) with the ratio between Coca Cola (KO) and copper futures.
We have included this chart because it does a nice job of showing exactly why we are fixating on the details. The reason is simple- the markets have spent much of the past two months trending in a manner that is wholly inconsistent with our thesis.
The point is that if the trend was going to reverse around mid-year then the sum of copper and crude oil ‘should’ have peaked in June along with 10-year Treasury yields and the Coke/copper ratio ‘should’ have bottomed along with the JNJ/FCX ratio. Instead of pivoting back in the other direction broke to new extremes into August.
Our thought is that we are either wrong- and we will receive confirmation of this through a return to rising long-term yields and a clear break down by the JNJ/FCX ratio or we are going to end up being rather dramatically right. By ‘dramatically’ we mean that copper prices will have to fall rather sharply elevating the KO/copper ratio and pulling the sum of copper and crude oil lower.
In terms of near-term price forecasts something like 2.20 copper and 60 crude oil would work nicely as this would take the sum of the two back down to the 400 level (220 plus 3 times 60 equals 400). At the same time the copper etf (JJC) would have to decline from close to 40 back towards 30.
Only time will tell how this will resolve but the longer the markets diverge from our expected path the greater the likelihood that our thesis is incorrect. With that in mind we find ourselves fixating on the day-to-day details of relative price action.