We are going to do something new today. The bottom line is that the argument is bearish for gold and bonds and points to at least the potential for a very strong equity markets rally through November.
The argument begins with a bit of a mental leap as we compare the share price of Coke to the CRB Index and Cisco to gold futures prices.
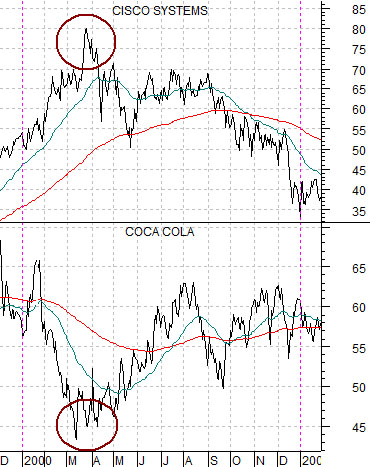
Below is a comparison between Cisco (CSCO) and Coca Cola (KO) from 1997 into 2001. The view is that the Nasdaq’s ‘bubble’ into 2000 was the tail end of a much larger trend that involved ‘large cap’ U.S. equities. The trend narrowed in 1998 as one sector after another lost momentum leading into a concentrated and highly focused trend that drove the Nasdaq to its final peak in 2000.
Our point is that Coke was an integral part of the theme through the early stages but as it began to falter after reaching unsustainable levels of valuation the trend narrowed. Coke peaked in 1998 leading to a rotation of money into the tech sector which, in turn, created the Nasdaq’s ‘bubble’.
If the Nasdaq was the tail wagged by the ‘large cap U.S.’ stock markets trend then we will argue that gold is the trailing edge of the theme that has dominated the markets over much of the last decade- commodity prices.
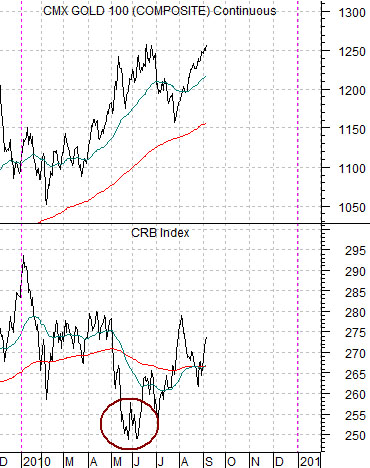
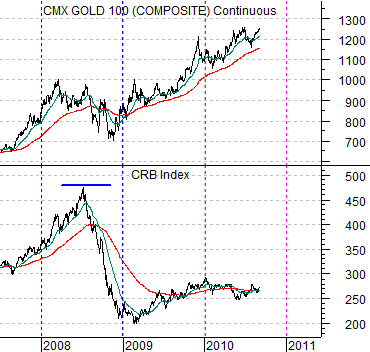
Next is a chart comparison between gold futures and the CRB Index. This chart runs from 2007 to the present day. We have lined up this comparison so that it covers the same basic time period- ten years later- as the Coke/Cisco chart.
Coke peaked in 1998. The CRB Index peaked in 2008. The Nasdaq continued to rise into 2000 and in the current situation we see gold prices pushing to new highs into 2010.
While it may or may not be fair to use Cisco as a surrogate for the Nasdaq in 2000 the argument is that gold price strength is an extension of a much larger trend that began to lose momentum more than two years ago. If history were to repeat gold futures would likely give back a substantial portion of the price gain garnered since the last test of the 700 level in late 2008.
Equity/Bond Markets
Now… this is where things get somewhat interesting. Would a decline in gold prices require an even more serious decline in general commodity prices? Could a decline in gold prices actually go with a rise in the CRB Index? We think the latter may be the more likely option.
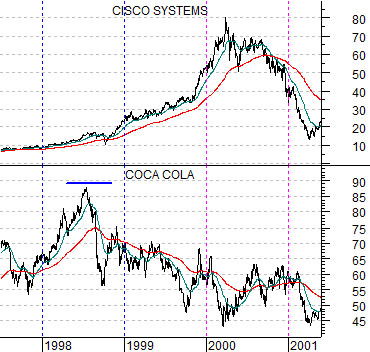
Below is the comparison between Cisco and Coke from the end of 1999 into the start of 2001. In essence we are looking at what happened to Coke when Cisco’s share price finally started to weaken in 2000.
The chart shows that Coke bottomed in March of 2000 at the peak for Cisco. Once the tech trend started to crack the offset was a rise in those sectors that had been under pressure as a result of rising interest rates.
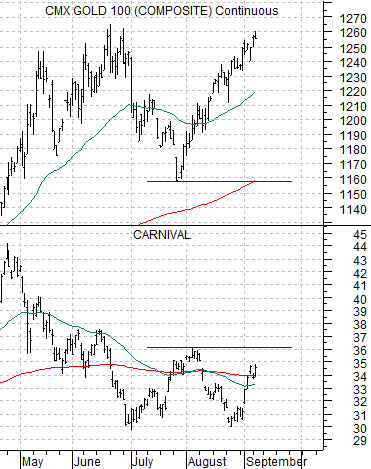
Further below we feature gold futures and the CRB Index from December of 2009 to the present day.
If our thesis is correct then weakness in gold should go directly with strength in the CRB Index. In 2000 the peak for the Nasdaq marked the end of UPWARD pressure on credit costs. Our thought is that in 2010 the peak for gold will mark the end of DOWNWARD pressure on credit costs.
The charts suggest something rather intriguing. It is possible that a trend change began roughly three months ago when gold futures made a hard run down towards the 200-day e.m.a. line in a manner similar to Cisco between March and May of 2000. The twist, of course, is that gold prices have risen back to the highs. Our thought here is that something like the share price of Carnival (CCL) should be acting as an offset to gold prices. As CCL swings back towards the early August highs a case can be made that gold prices simply haven’t received the memo that a bear market began back in June.