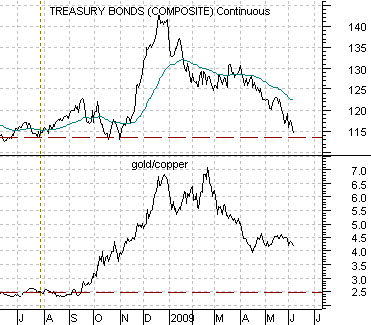
We start off today with a comparison between the U.S. 30-year T-Bond futures and the ratio of gold to copper futures prices.
The basic idea is that copper prices are driven by economic growth and tend to rise when bond prices are falling while gold is more of a store of value or cash substitute. In other words when interest rates are trending lower and long-term bond prices are trending higher the price of gold will rise relative to the price of copper. On the other hand when bond prices are falling we would expect to see the gold/copper ratio moving lower as well.
If we were to attempt to build a negative case for gold prices we would focus on two relationships. The first revolves around the Swiss franc while the second has to do with the direction of the long end of the Treasury market, the position of the gold/copper ratio, and the potential for copper price weakness.
To explain… to the extent that bond prices have been falling there has been a certain amount of downward pressure on the gold/copper ratio. While most certainly not a given we can at least point out that the ratio was holding near 2.5:1 through into the late summer of 2008. In other words if copper prices remained flat at current levels and the gold/copper ratio declined back to 2.5:1 then gold prices would have to move all the way down close to 560.
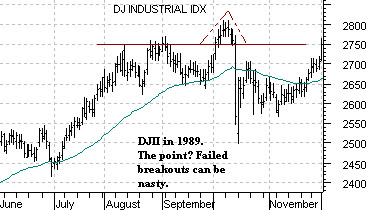
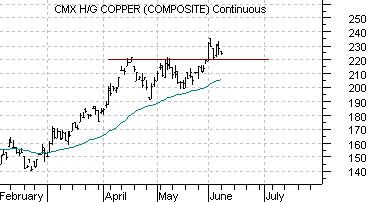
Belowwe feature a comparison between the Dow Jones Industrial Index (DJII) from 1989 and copper futures from the current time period.
What does the 1989 DJII have to do with copper prices today? Not much. The point is that when a market breaks up through resistance- as was the case with the equity market in 1989- and then fails… it can lead to very sharp price corrections because the shorts who would ordinarily support prices as they cover their positions were blown out during the price break out.
The argument is that if copper prices were to break back below 2.20 one of two things would happen. Either bond prices would remain under pressure which would put rather intense pressure on gold prices or… the bond market would snap upwards in price with the TBonds heading back towards previous support near 125.
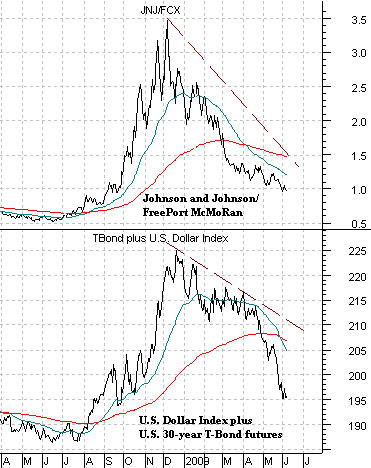
Below we have included a chart of the ratio between Johnson and Johnson and FreePort McMoRan (JNJ/FCX) and the sum of the U.S. 30-year T-Bond futures and U.S. Dollar Index (DXY) futures.
The first point would be that ‘the trend’ since late 2008 has included falling bond prices and a weaker dollar and relative strength by copper producer FCX against consumer products company JNJ.
The second point is that on the off chance that copper prices were to fail back below 2.20 we would expect to see bond prices and the dollar moving higher along with the JNJ/FCX ratio.
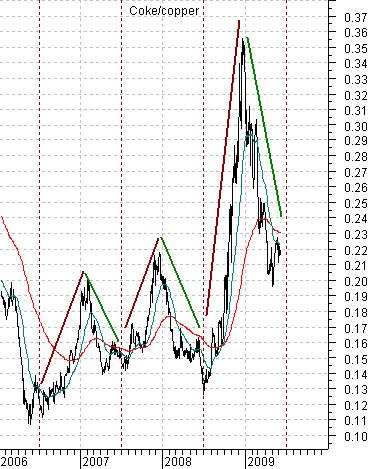
In recent years (2006- 2008) the markets have exhibited a somewhat peculiar tendency to shift to a commodity-based theme around the start of the year and then to a non-commodity theme around the end of June.
We show this through the ratio between the share price of Coca Cola (KO) and copper futures below right. The ratio has tended to rise from January through June and then decline from July through year end. If history were to be kind enough to repeat the argument would be that we are approaching the end of the cyclical recovery rally. As an aside… this says very little about the direction of the major stock market indices. The Coke/copper ratio rose in 2006 as the S&P 500 Index pushed upwards, rose again in 2007 through a flat stock market, and rose a third time in 2008 as the stock market collapse.
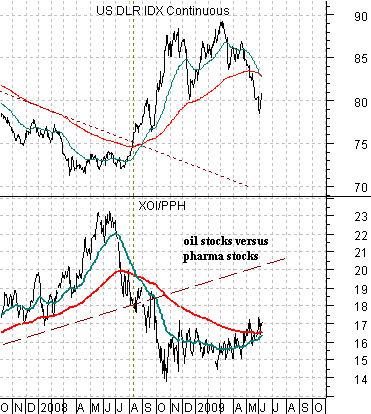
The chart below compares the U.S. Dollar Index (DXY) futures and the ratio between the Amex Oil Index (XOI) and pharma etf (PPH).
The simple point is that a stronger dollar will tend to go with better action in the consumer and pharma sectors while a weaker dollar favors the oils and mines.