The equity and commodity markets continue to rise as the U.S. dollar weakens. In a sense the forex markets are pushing growth towards the U.S. and taking it away from the stronger currency countries even as investors pile into trades predicated on a diametrically opposing view.
In any event… the only problem that we can see with this trend is that eventually the dollar will rise. Maybe not today and perhaps not even this quarter but positions put on strictly based on dollar weakness are at risk any time the dollar swings higher. And it will. From these or lower levels of course.
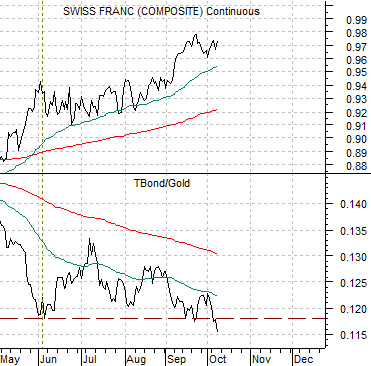
At right we return to the comparison between the Swiss franc futures and the ratio between the U.S. 30-year T-Bond futures and gold futures.
The argument has been that as long as the TBond/gold ratio held the lows that have repeatedly been tested since 2008 the absolute upside potential for gold prices was limited by the bond market. At the bottoms for the ratio the Swiss franc has been at its highs which simply means that dollar bottoms tend to occur when the ratio is on the support line.
The chart shows, however, that the support line was taken out yesterday after gold prices rose once again and then held the gains after the bond market did a quick intraday price reversal.
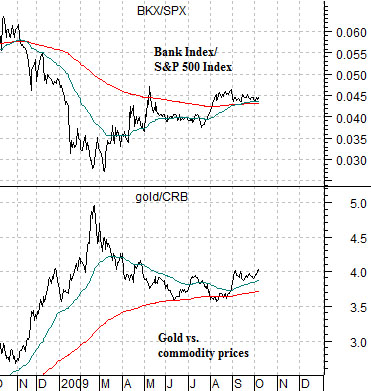
The chart below right compares the ratio of the Bank Index (BKX) to the S&P 500 Index (SPX) with the ratio between gold prices and the CRB Index.
Over a rather extended period of time the ratio of gold to the CRB Index ranged from a rather ‘hard’ bottom around 1.2:1 up to a fairly consistent top just through 2:1. In other words based on the CRB Index at or near 264 the expected trading range for gold would lie between roughly 320 and 530.
Our view has been that gold north of 530 is a reflection of dollar weakness and… banking weakness. Our focus of late has been on the BKX/SPX ratio because on the one hand gold prices keep ‘saying’ that the banks are going to go into yet another late-year swoon while the equity market argues in turn that ‘cyclical’ and ‘risk’ are back in vogue. New recovery highs for the BKX/SPX ratio should be a negative for gold prices but may have to wait until the dollar finds some kind of near-term bottom.
Equity/Bond Markets
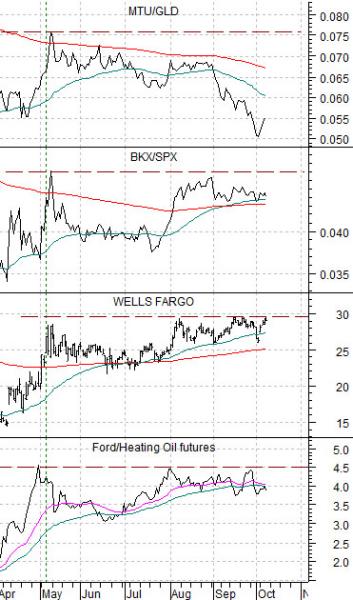
At right we show the Ford/heating oil ratio, Wells Fargo (WFC), the BKX/SPX ratio, and the ratio between Japan’s Mitsubishi UFJ (MTU) and the gold etf (GLD).
This is basically the same argument as the one on the first page today. On the one side we have the banks (Wells Fargo, MTU, and the BKX) as well as the non-energy cyclicals (Ford) while on the other side we find gold prices and energy prices. If WFC were to push cleanly up through 30 with the F/heating oil and BKX/SPX ratios following… the banks will benefit and gold prices will suffer. If the ratios start to buckle, however, then we are back to a commodity-driven higher interest rate trend.
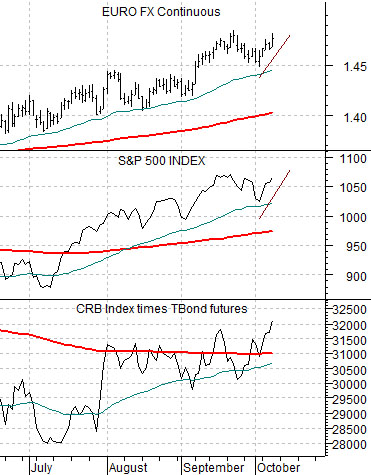
Below we compare the euro futures, S&P 500 Index, and the combination of commodity prices times bond prices (CRB Index times U.S. 30-year T-Bond futures). The trend for the SPX quite obviously is exactly the same as the trend for the euro. Take the euro through 1.50 and it is happy days indeed for the stock markets. Pull the euro back below 1.45 and stocks will be lower. Simple stuff.
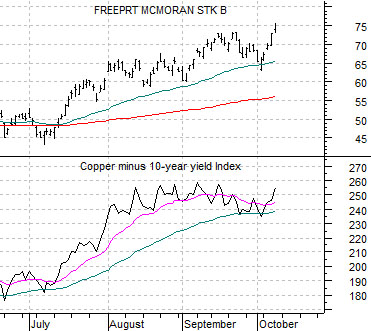
Below right we show once again the comparison between FreePort McMoRan (FCX) and the spread or difference between copper futures and 10-year Treasury yields.
Yesterday copper futures rose by more than 11 cents while yields swung from around 3.17% to 3.25%. The ‘11’ cent rise in copper trumped the ‘8’ point rise in yields taking the spread upwards which, in turn, helped push FCX up by 3% on the session. The point is that as long as copper is stronger than yields… the mines and metals will continue to do well.