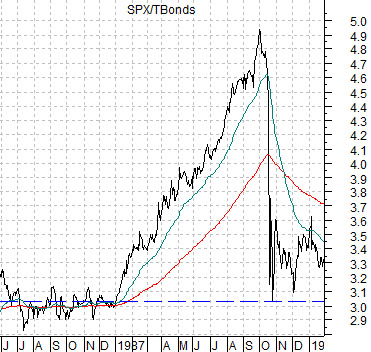
A major equity bull market began in August of 1982. Five years later- to the month- the ratio between the S&P 500 Index and the U.S. 30-year T-bond futures (SPX/TBonds) rose to a peak. Then it crashed. Our argument has been that gold in terms of the euro may well be in a similar position today.
The chart below shows the ratio between the SPX and the TBond futures from June of 1986 through into January of 1988. Starting in January of 1987 the ratio went ballistic as money poured out of the bond market and into the equity market. Month after month the ratio drove higher and while just about everyone involved in the markets at that time knew that something was not right… it is very difficult to get out of an stay out of such a well defined trend.
After the equity markets peaked in August of 1987 the ratio continued to rise as bond prices moved lower. At the start of the fourth quarter the trend reversed. Hard. Very hard.
The point, however, is that the correction by the ratio back to its starting point at the end of 1986 did not change the trend. After a months of chopping back and forth the SPX/TBonds ratio turned upwards once again although it was close to 4 years before it finally made new highs. Note that a ratio that failed so dramatically just below 5:1 in 1987 ended up peaking at the end of 1999 close to 16.5:1.
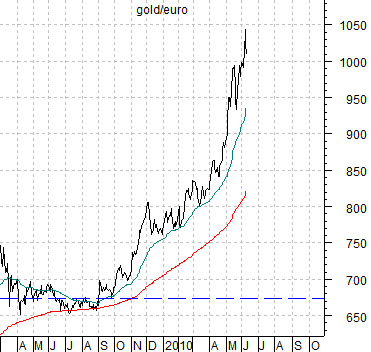
Below we show the gold/euro ratio. This is the price of gold in terms of the euro.
The SPX/TBond ratio turned higher in August of 1982 with the stock market peaking in August of 1987. The gold/euro ratio turned upwards in June of 2005 and, perhaps coincidentally, the price of gold reached a peak five years later in June of 2010.
Our view is that if things get a bit crazed within the markets over the next month or so the gold/euro ratio could snap back down to around 700. While that might seem quite bearish all it would take is a rally by the euro up to the 200-day e.m.a. line (around 1.35) and a decline in the dollar price of gold back to roughly 950.
If the gold/euro ratio follows a similar path to the post-1987 SPX/TBond ratio then eventually- perhaps years from now- it will rise to new highs and a decade or so from now we may be recalling how attractive the price of gold was during the second half of 2010 following the mid-year relative strength price ‘adjustment’.
Equity/Bond Markets
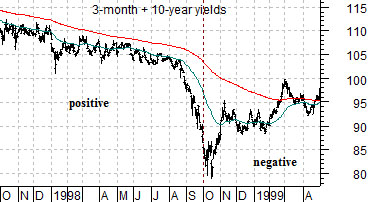
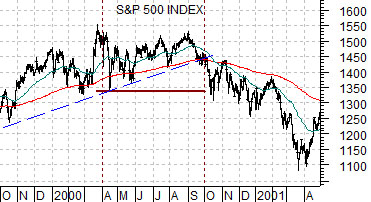
In yesterday’s issue we showed the 2-year lag between interest rates and the S&P 500 Index through the bull market peak in 2000. In actuality we showed the trend for yields through 1998 and then compared this to the trend for the equity markets during 2000.
The 2-year lag was never supposed to be exactly 2 years. It might, in fact, be a bit shorter or a bit longer or it could very well vary somewhat from cycle to cycle but for our purposes we tend to line up the charts as close to 2 years apart as possible.
The argument was that the melt down in the Nasdaq and S&P 500 Index during the final quarter of 2000 made sense because interest rates bottomed in October of 1998 and began to rise. The negative impact of a trend towards higher interest rates in the fourth quarter of 1998 caught up with the markets during the final quarter of 2000. Fair enough.
As we worked through the comparison between yields in 1998 and the SPX in 2000 we found that it fit almost perfectly. Sort of. The chart of the SPX at right shows (rising blue trend line) that support was clearly broken around the end of September in 2000.
The problem is that there is a difference between the bull market peak- which took place at the end of March that year- and the break down through support which followed six months later around the start of the fourth quarter. We can argue that the trend remained positive through the first three quarters of 2000 but the reality is that the peak for the cycle was made six months earlier.
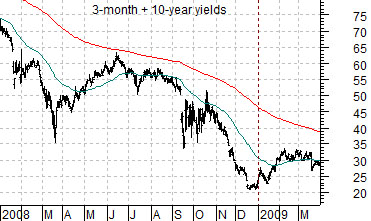
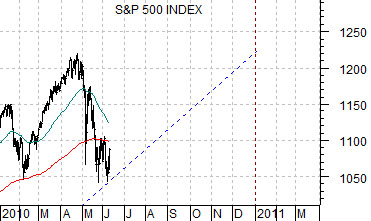
Why are we fussing about this? Because a literal interpretation of the 2-year lag (below right) suggests that the cyclical trend may turn negative around the end of this year. Roughly six months from now. The same length of time between the peak for the SPX in March of 2000 and the trend break down at the end of September.
Based on the 2-year lag the markets should continue to exhibit a healthy cyclical trend for another two quarters. This means that relative strength during rallies will be focused in the economically sectors and that the markets will tend to respond positively to days when commodity prices rise and bond prices decline.
The twist is that we have no way of knowing at this juncture whether the SPX will be able to rise above the April peak during the final six months of the year even as we have been arguing for a bullish resolution once bond and gold prices start to decline.
If the argument is that the SPX could peak as much as six months ahead of a turn towards cyclical weakness then the next step is to compare the current situation with that of the first quarter of 2000. Obviously we wouldn’t be mentioning this if we hadn’t already set it up so take this as an explanation for why we have varied from our usual format by focusing on the equity and bond markets on today’s third page.
June 10 (Bloomberg) — Treasuries extended losses after the U.S. sold $13 billion of 30-year bonds as reports showed evidence of global economic strength and stocks rallied.
