In general the price of gold rises when the U.S. dollar is falling. In general gold prices outperform copper prices when interest rates are declining. In general the best intermarket back drop for gold prices would be a weak dollar trend, falling interest rates, and strong copper prices. In other words… pretty close to exactly what the markets have been doing over the past year or so.
The issue isn’t whether gold prices should be strong because, of course, they have been. The issue instead of whether they can continue to rise sufficiently from current levels to warrant going long this week’s price break out. We aren’t writing about 1040 to 1060 or even 1100 for the same reasons that we wouldn’t be interested in a 10.40 stock that had to the potential to rise all the way to 11.00. To justify being long gold north of 1000 one has to believe that prices are going to push on to 1200, 1500, or even 2000.
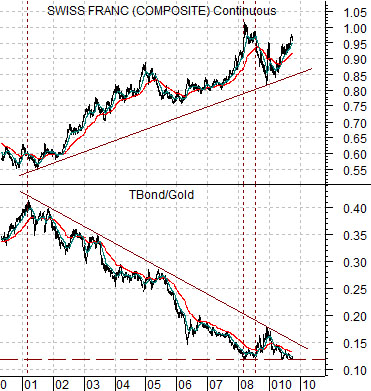
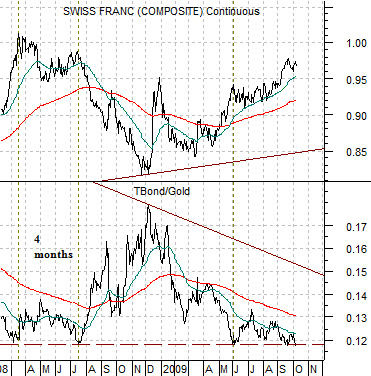
Below we show the Swiss franc futures and the ratio between the price of the U.S. 30-year T-Bond futures and gold futures. While many believe that gold prices trend inversely to the dollar in general gold prices tend to trend with the Swiss franc. We could also argue that they trend with the Aussie dollar/Canadian dollar cross rate but that does little more than muddy the waters.
From early 2001 to the present day the trend for the Swiss franc has been higher while the TBond/gold ratio has been lower. One could argue that as long as the franc continues to push upwards while the TBond/gold ratio moves lower… gold prices will remain in a positive trend. Fair enough.
The problem- from our perspective- has to do with .1175. From early 2008 to the current time period the ratio between the TBond and gold prices has repeatedly and consistently found support just below .12. In other words if the TBonds are trading at 120 the price of gold can rise above 1000. If the TBonds are at 122 the price of gold can push 1040. At 130 gold can nibble above 1100. And so on.
When the ratio decline to support last year it marked the highs for the Swiss franc. The ratio made a second bottom four months later right in front of a downward slide for the franc that went with something close to a 300 point hair cut for gold prices. Now that the ratio is making its second test of the support line… four months after the initial test at the start of June… if history were to repeat the next 200 points are more likely to the down side than the upside.
Equity/Bond Markets
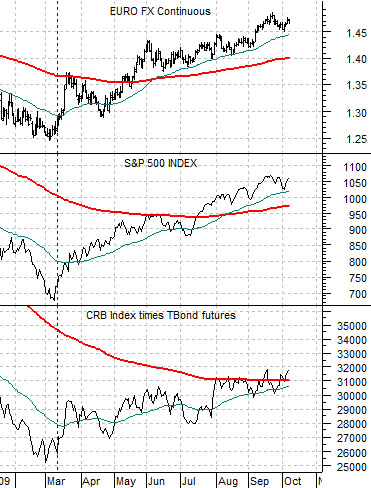
The chart below compares the euro futures, S&P 500 Index, and the CRB Index (commodity prices) multiplied by the U.S. 30-year T-Bond futures (bond prices).
One of the key features of the 1982 bear market bottom and subsequent bull market recovery was the relationship between the S&P 500 Index and ‘commodities times bonds’. Both bottomed together and both rose to begin the new bull market together. The current situation is actually quite similar but the caveat- and it is likely a big one- is that all of this has gone with a rising euro (and falling dollar). The first significant test of the stock market’s recovery will come once the euro finally turns lower.
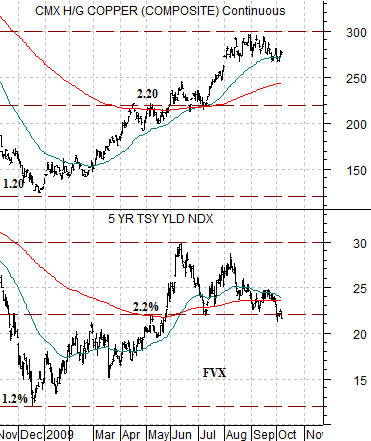
To cover the next topic we are going to require two comparative charts. To start with we have included copper futures and the yield index for 5-year U.S. Treasuries below.
We have argued that copper prices and 5-year yields have been very similar over the past year or so. When yields fell from around 3.5% copper prices were close to 3.50, when yields bottomed at 1.2% copper prices touched 1.20, and at the peak this year yields stretched up to 3.0% followed a few months later by copper hitting 3.00.
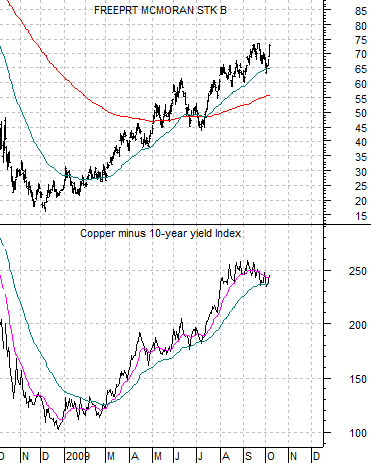
In any event… yields are now below 2.2% while copper is just below 2.80. This ‘gap’ is significant and is one of the reasons the stock market has been stronger. At bottom right we compare FreePort McMoRan (FCX) and the spread between copper prices and 10-year Treasury yields. When copper prices are stronger than yields (i.e. the spread line is rising) the equity markets tend to be positive. Falling yields are always a positive- it is the reason yields are falling that is the negative. As long as the spread between copper prices and Treasury yields continues to grind higher… the equity markets in general will remain bullish.