April 15 (Bloomberg) — Brazil’s real fell after the central bank bought dollars for a second time today and investors speculated the government is concerned about the impact of the currency’s appreciation on exporters.
We included the Bloomberg comment above simply because the Brazilian currency is part of the broader Asian/BRIC/commodity trend. In trading yesterday the U.S. dollar moved marginally higher, the Canadian dollar stalled just below parity, and the commodity markets paused near the highs.
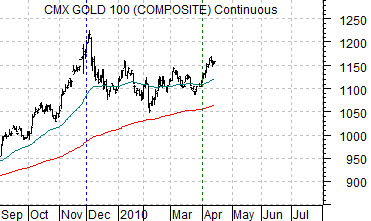
We read a comment yesterday from an analyst who was apparently quite enthused about the upside-down head and shoulders pattern recently carved out by gold futures. While that may prove to be the case the chart seemed a bit too similar to the first half of 2008 for comfort.
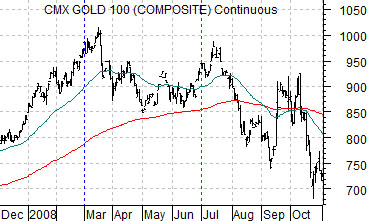
Below we show a chart of gold futures from December of 2007 through October of 2008. Just below this chart we have added gold futures from September of 2009 to the present day.
The point is that gold prices made two peaks in 2008 spaced around four months apart. We imagine that if we tried hard enough we could find an upside down head and shoulders pattern in this chart just ahead of the second peak that led into a 30% correction.
Our thought is that gold prices made one top last December at the peak for Swiss franc and could be making a second top this month IF the commodity currencies (Cdn dollar, Aussie dollar, Brazilian real, etc.) begin to weaken.
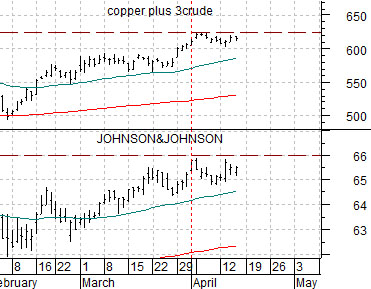
Below is a comparison between the combination of copper and crude oil futures and the share price of Johnson and Johnson (JNJ).
The idea here is that through the first half of April both ‘sides’ of the markets have been attempting to push to new highs. The sum of copper and crude oil has remained flat over the past two weeks while JNJ has remained below what we view as resistance around 66. If copper and crude oil break higher then the commodity trend remains intact but if JNJ manages to swing to new highs then a case can be made that the commodity trend has reached a peak. If this proves to be the case then gold prices could follow the 2008 example by resolving to the down side later this quarter.
Yields, copper, and semiconductors.
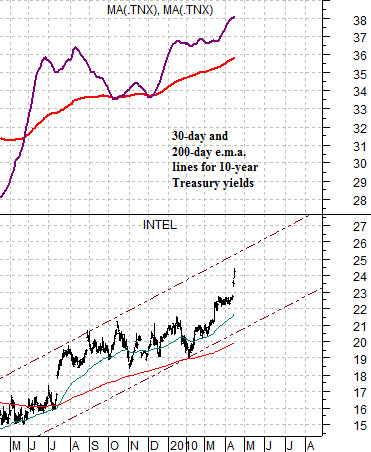
Below we compare the share price of Intel (INTC) to two moving average lines for 10-year Treasury yields. The argument has been that INTC should remain positive until the shorter-term (30-day e.m.a.) line crosses down through the 200-day e.m.a. line. Obviously that isn’t going to happen in the immediate future which perhaps explains why INTC is making new recovery highs this week.
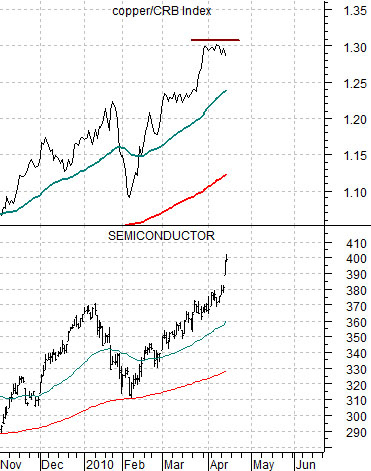
Further below is a chart of the Philadelphia Semiconductor Index (SOX) and the ratio between copper futures and the CRB Index.
The argument has been that WHEN the copper/CRB Index ratio reaches a peak the markets have shown a tendency to swing over to another cyclical trend. In 1995- 96 the shift was towards the semiconductors while in 2006 it favored the agriculture sector.
The key- obviously- is a top for the copper/CRB Index ratio. Notice that it started to flatten out somewhat at the end of March when the SOX reached the previous high around 370. The bust out to new highs by the chip stocks has gone with a flat copper/CRB Index ratio. Our point? Strangely enough this particular argument may actually be working.
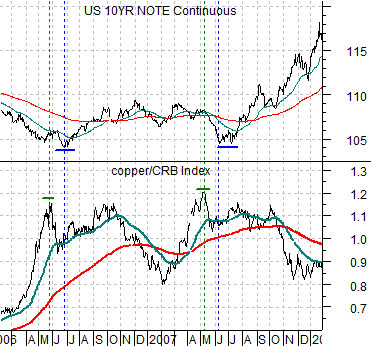
Below is a comparison between the copper/CRB Index ratio and U.S. 10-year T-Note futures from 2006 into 2008.
On the two occasions when the copper/CRB Index ratio made a top (May of 2006 and May of 2007) the bond market did not reach bottom in terms of prices for another month. While this may not repeat in the current cycle it does give us something to work with.
If the copper/CRB Index ratio has peaked then the bond market is close to a bottom. It may still have one last thumping ahead of it but if history were to repeat that would set the lows. If the bond market is close to a bottom then yields are obviously close to a top which means that over time the moving average lines for 10-year Treasury yields will begin to flatten out until they eventually ‘cross’. For now the trend remains positive.
