Today’s second and third pages have much to do with the share price of Japanese consumer products maker Panasonic (PC). However we are going to start things off with a broad-based macro perspective as we work to determine the nature of the current trend.
Essentially a market can have one of three trends- up, down, or sideways. One of our views, however, is that the trend is generally a reflection of one of four different combinations with respect to the U.S. Dollar Index futures and U.S. 30-year T-Bond futures. Since we have done this on quite a few occasions in the past we will attempt to not get bogged down in the details.
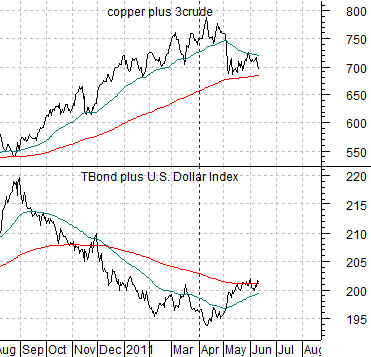
To keep things as simple as possible the dollar can either be up or down and bond prices can either be trending higher or lower. In terms of the combination of both markets the sum of the U.S. Dollar Index (DXY) and TBonds can either be trending higher or trending lower. The spread between the two (TBonds minus DXY) can also be trending higher or lower.
When the sum of the dollar and TBonds is declining the trend tends to favor energy and base metals. The weaker dollar supports rising commodity prices while weaker bond prices go with a stronger cyclical trend.
When the sum of the dollar and TBonds is rising the trend tends to favor large-cap non-commodity growth and defensive stocks. This was essentially the trend from 1995- 98.
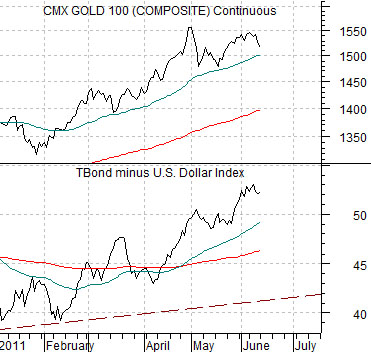
When the spread between the TBond and DXY is rising (strong bonds and/or weak dollar) the trend tends to favor gold.
When the spread is declining (strong dollar and/or weak bonds) the trend tends to favor non-commodity cyclicals. This was most certainly the case post-Asian crisis in 1999.
Where do things stand at present? The sum of the TBonds and DXY is starting to rise (chart below) putting pressure on energy and base metals prices. The spread between the TBonds and DXY is still trending higher (next chart at bottom supporting gold prices. While we obviously have a number of views on what is going to happen during the second half of this year the point is that this is what is pressuring the markets in the here and now.
Equity/Bond Markets
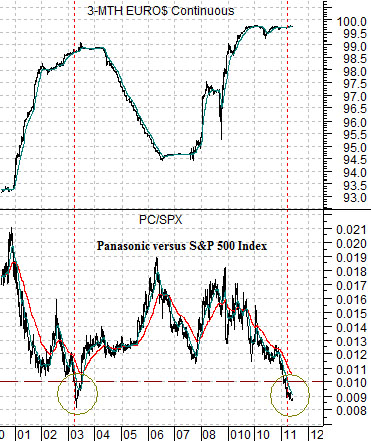
We mentioned in yesterday’s issue that it is probably time to start paying attention to the share price of Panasonic (PC). We are using PC as a laggard cyclical.
Just below is a chart comparison between 3-month eurodollar futures and the ratio between PC and the S&P 500 Index (SPX) from 2000 up to the present day.
Let’s start with the obvious- the PC/SPX ratio is currently ‘low’. Not quite as ‘low’ as it was in 2003 but definitely within the same area code.
The argument is that a sequence of markets events began back in 2003. First, the PC/SPX ratio fell below .01 (i.e. PC was less than 1% of the value of the SPX). Second, the ratio pivoted back to the upside. Third, the long end of the bond market reached a price peak. Fourth, short-term eurodollar futures prices began to decline (i.e. the markets started to push short-term yields higher). Fifth, long-term bond prices bottomed as the Fed started to raise the funds rate. From start to finish this process took about 15 months.
Returning to the chart we notice that 3-month eurodollar futures prices did not begin to decline (rising short-term yields) until some time after the PC/SPX ratio started to rise. In other words one of the things that may have to happen well in advance of the first Fed rate hike is a strong rebound in the relative strength of Panasonic.
In terms of the current situation notice that the PC/SPX ratio is currently below .01 and… 3-month eurodollar futures prices are still holding just below 100. There has been no upside pressure on the PC/SPX ratio and certainly no upside pressure on U.S. short-term yields. So far.
On the following page we will show a few more of the details but for now we will simply state that the PC/SPX ratio declined below .01 at the end of March in 2003 and moved back above .01 at the end of June. This marks the start of our sequence.
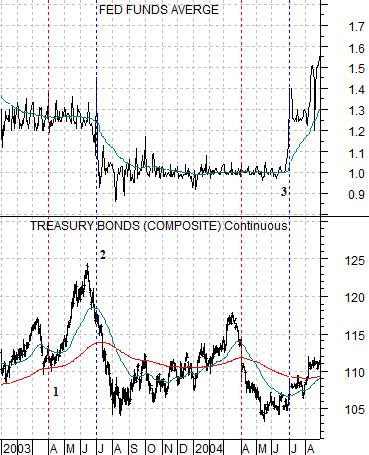
Next is a comparison between the Fed funds target rate and U.S. 30-year T-Bond futures. What we are attempting to do is set up the timing of the sequence that started with a bottom for the PC/SPX ratio and ended with a low for long-term bond prices and a rising Fed funds rate.
The PC/SPX ratio held below .01 from April through June. This was the period of time when the TBond futures drove to a final peak. In other words weakness in the ratio is consistent with an upward spike for bond prices (which is exactly what has happened in recent months).
When the PC/SPX ratio declined below .01 in 2003 the bond market pushed higher. When the ratio rose back up to .01… the bond market peaked in price.
Twelve months after the PC/SPX ratio moved below .01 3-month eurodollar YIELDS began to rise.
Twelve months after the PC/SPX ratio moved back up to .01 with long-term bond prices reaching a peak… the Fed started to raise the Funds rate.