There never seems to be a good time to step away from the markets but it has been our habit most years to take the first part of December off. Our view is and has been that the cyclical trend will remain stronger through year end so we trust that nothing too unexpected will occur over the next while. The recent correction has taken the edge off of the bullish froth while yesterday’s weekly jobless claims report helped to solidify the bullish trend.
In a sense the current situation lies somewhere between strange and bizarre. We can argue that the markets are in a similar position to late 2000- just ahead of the equity bear market- and the summer of 1997- just in front of the ‘crash’ for the Hong Kong stock market. We can also cobble together a fairly compelling argument that conditions today are, in fact, similar to mid-2003 when the Fed took the funds rate to the cycle bottom as long-term yields began to rise. The initial response to the latest round of quantitative easing suggests that this actually may make sense.
The problem is that the present case is likely a bit of both and unlike either. We are not at the end of a long-term bull market as we were in 2000 and we have yet to see much in the way of confirmation that money is starting to move away from Asia, Latin America, and the emerging markets which proved to be the case in 1997. We are most certainly not at the end of an equity bear market given that stocks have been higher since March of 2009.
Our point is that the markets are too speculative to be a bottom and too cautious to be a top. If we are going to see a trend change chances are it will occur quietly instead of with the blaring of horns and the banging of drums.
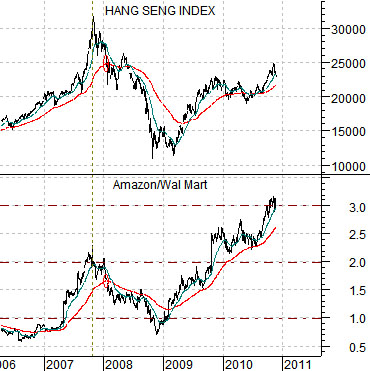
Below we show the Hang Seng Index from Hong Kong and the ratio between Amazon (AMZN) and Wal Mart (WMT). The AMZN/WMT ratio depicts the ‘growth’ trend that tends to power the Asian markets. The argument is that the cyclical trend turned positive over a year and a half ago.
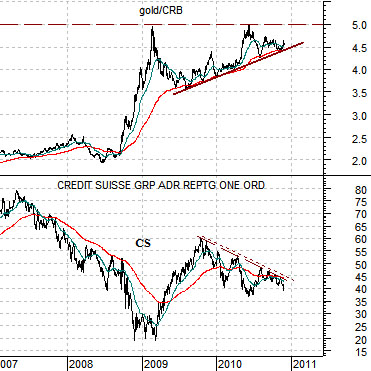
Below we show the gold/CRB Index and the share price of Credit Suisse (CS). While growth related to Asia swung higher in early 2009 the trend for growth related to real estate prices (i.e. the banks) remains under pressure as gold prices rise. On the one hand the markets are ‘high’- as depicted by the 3-fold rise in the AMZN/WMT ratio since early 2009 and on the other hand prices seem to be low when viewed from the perspective of the banking shares.
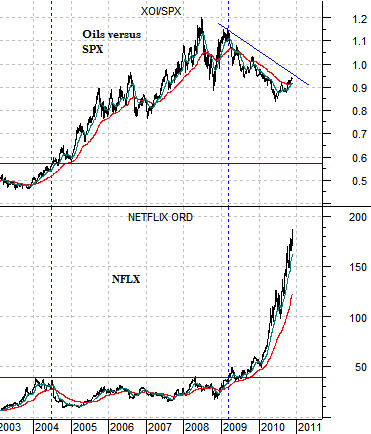
Below is a chart of Netflix (NFLX) and the ratio between the Amex Oil Index (XOI) and the S&P 500 Index (SPX).
In 2004 energy prices broke to new highs. This led to a very long trend that favored the energy sector as the XOI/SPX tracked upwards.
In early 2009 the energy theme began to weaken as new sectors started to show relative strength. After around 5 years of trading ‘flat’ the share price of NFLX began to scream higher. The current trend may include stronger crude oil prices but it also is based on relative weakness for the energy stocks.
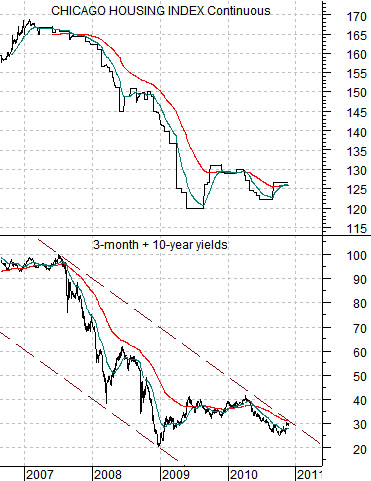
Below is a chart of the Chicago Housing Index futures and the sum of 3-month and 10-year Treasury yields. The various city Case-Schiller Indices are based on a value of ‘100’ in the year 2000. At present home prices in Chicago have risen by roughly 27% over the past 10- 11 years.
The argument is that when yields actually start to rise it will be the market’s way of ‘saying’ that U.S. home prices are beginning to improve. The close relationship between yields, home prices, and the bank stocks suggest that all three markets will tend to rise or fall at the same time.
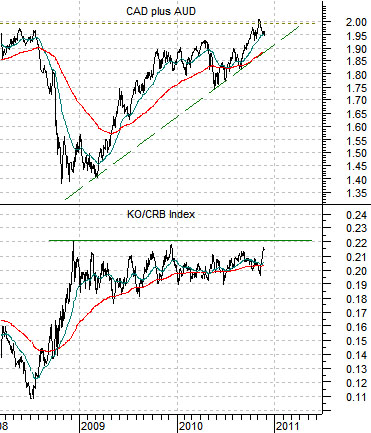
Below we show the sum of the Canadian and Australian (CAD plus AUD) dollar futures and the ratio between Coke (KO) and the CRB Index.
Over the longer run KO tends to be strong when commodity price are weak and vice versa. The KO/CRB Index ratio has been struggling with resistance since late 2008 around .22. The ratio probably won’t be able to move to new highs UNTIL the commodity currencies start to weaken although it may be that a push to new highs will actually mark the start of a declining trend for the commodity currencies.
