We commented near the start of last week that we were having trouble being bearish given our sense that cyclical asset prices could pivot higher at almost any time. As it turned out ‘any time’ was on Friday.
(Reuters) – Stocks surged on Friday to close out a sour quarter on a high note as investors cheered an agreement by European leaders to stabilize the region’s banks, a pact that helped remove some of the uncertainty that has plagued markets.
The point, however, isn’t that something changed on Friday but rather that the trend was in the process of changing through out the entire month of June.
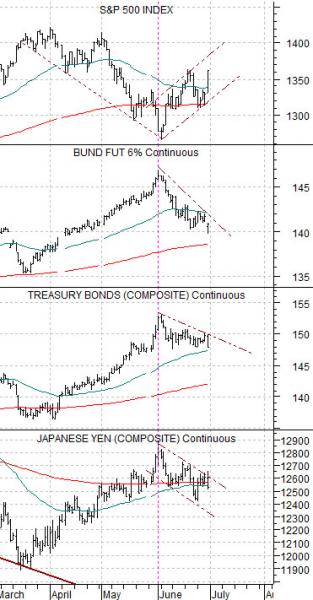
Below is our chart comparison of the S&P 500 Index, German bund futures, U.S. 30-year T-Bond futures, and the Japanese yen futures.
The argument is that the yen and bond prices trend in the same direction while the S&P 500 Index trends in the opposite direction. When bond prices and the yen are strong and rising it represents money moving away from the perceived risk associated with equities. Conversely when bond prices and the yen are working lower it suggests that capital is drifting back towards the equity markets.
We pointed out last week that the German bund futures had been trending lower since the start of June. The most obvious explanation for this would be that the credit quality of German debt was deteriorating but… that wouldn’t account for the lack of strength in the long end of the U.S. Treasury market or the downward drift in the value of the Japanese yen relative to the U.S. dollar.
It has been our experience that one shouldn’t argue with the bond market. This doesn’t stop us from doing exactly that from time to time but as we noticed the declining trend for German bonds, the lack of ‘new highs’ for both U.S. and Japanese long-term bond futures, and the pressure on the Japanese yen our conclusion was that it was very difficult to hold a bearish view on cyclical asset prices. Why? Because unless the markets found some way to escalate the Eurozone crisis to new levels with bond prices ripping back to the upside the natural trend for the S&P 500 Index was ‘higher’.
Equity/Bond Markets
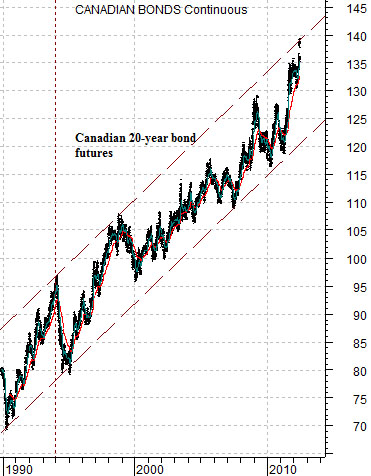
Below is a chart of the Canadian 20-year bond futures.
The argument has been that the Canadian bond futures are ‘channel top’. In other words, given the trend for prices since 1989 the Canadian bond futures would appear to be price levels associated with some kind of cycle peak.
We pointed out last week that the Canadian bond futures had been at the top of the channel at the start of 1994 and then again twice in 1999. In both cases a cyclical rally developed as bond prices declined with the major difference being the subsequent trend for the U.S. dollar. In 1994 the dollar was weaker which led to a commodity price-based rally while in 1999 the dollar was stronger as money moved into the tech and telecom sectors.
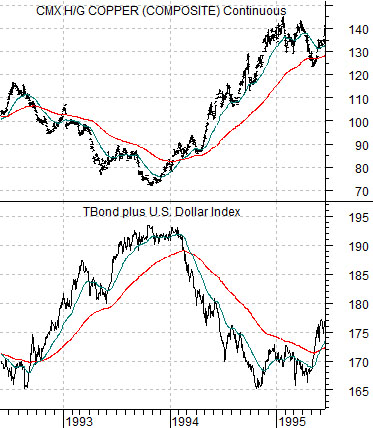
Next is a chart of copper futures and the sum of the U.S. 30-year T-Bond futures and U.S. Dollar Index (DXY) futures from 1992- 95.
The rising trend for copper prices went with weakness through 1994 from both the bond market and dollar. Fair enough.
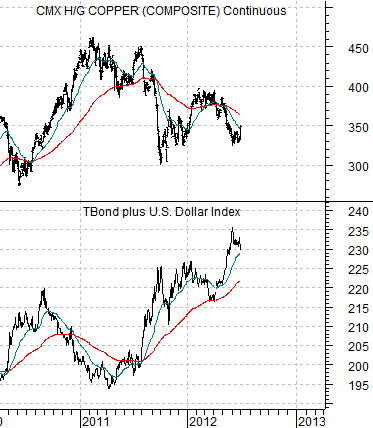
The initial reaction from the markets at the end of last week included a declining bond market as well as dollar weakness. The set up for the current situation is shown below using the comparison between copper and the sum of the TBond and DXY.
The point here is that while we only have one day’s worth of trading data to consider the immediate reaction created downward pressure on long-term bond prices and the dollar. This is the sort of trend that goes with rising copper prices, commodity price strength, and an improved outlook for Asian growth.