We attempted to make the argument last month that the only bearish outcome for equities in general would be a very strong bond market. If bond prices simply flat-lined near the highs set at the end of May then the consumer and defensive sectors would strengthen. On the other hand if bond prices declined sharply then the cyclical stocks would lead the charge higher.
We can make the case that the consumer and defensive stocks are still in need of a bit more of a run. The cyclical sectors tend to show strength from the autumn into the spring so on a seasonal basis it wouldn’t be too much of a surprise if the third quarter consisted of a somewhat flat bond market, continued downward pressure on energy prices, and additional price strength for health care-related issues.
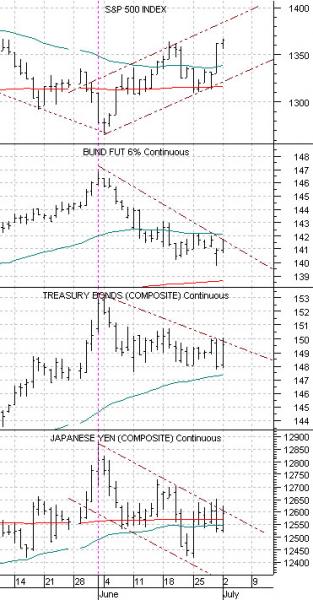
Below is the same chart that we ran in yesterday’s issue. It features, from top to bottom, the S&P 500 Index, German bund futures, U.S. 30-year T-Bond futures, and the Japanese yen futures.
What intrigued us about the trading yesterday was the strength in the bond market and yen coupled with a late-day rally for the S&P 500 Index that helped to carry prices slightly higher. It was the kind of day that suggested that the markets aren’t quite ready to embrace the cyclically positive aspects of an improving Eurozone situation.
The point, we suppose, is that the initial direction taken by a number of markets last Friday is still somewhat suspect. We didn’t see the kind of carry through in trading yesterday that would really help to ‘lock in’ a new trend. Bond prices were stronger, the Japanese yen notched upwards, crude oil was lower along with gold and copper.
Obviously the markets can do almost anything on any given day- especially on the first day of a new quarter- but our sense was that this was not the way a market heading into a powerful cyclical rebound should respond. Chances are the cyclical trend is going to have to tread water until we start to see indications of a declining trend for weekly U.S. jobless claims.
Equity/Bond Markets
We are going to return to an argument that we have made on a few occasions in the past. It has to do with the way key trend changes often seem to be made with a 9-month lag.
While it will take us through the end of page 3 to complete our chart-based argument the conclusion is that if the stock market continues to rise this is about the right time and place for long-term yields to turn upwards.
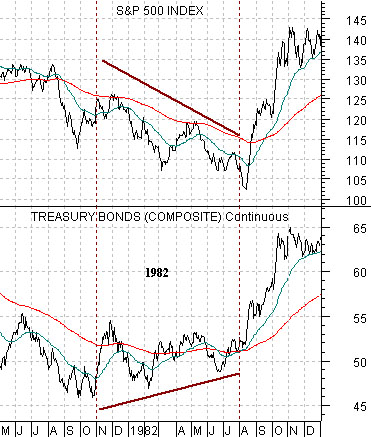
To begin we are going to show a few examples of 9-month lags. Just below is a chart of the S&P 500 Index and U.S. 30-year T-Bond futures from 1981- 82.
In the ‘old days’ stocks used to trend generally with bonds. The detail that we are focusing on in this instance is the way the bond market bottomed in price in the autumn of 1981 even as the S&P 500 Index continued to work lower.
The SPX made its final bottom in August of 1982. Between the cycle lows for the TBonds around the end of October in 1981 to the cycle lows for the S&P 500 Index in August of 1982… a time span of around 9 months elapsed.
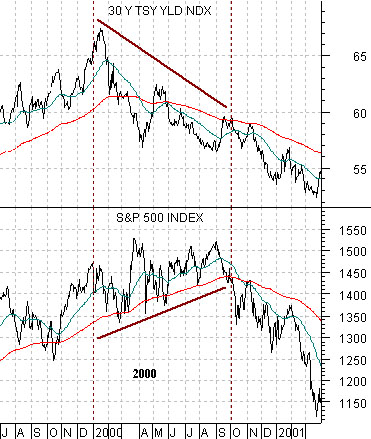
Below is a comparison between 30-year Treasury yields and the S&P 500 Index from 1999- 2001.
Our view is that in an inflationary trend the bond market and stock market trend in the same general direction. In a deflationary trend bonds and stocks trend in opposite directions. An inflationary trend includes an upward bias for producer prices that helps to stimulate earnings growth. Rising interest rates compress valuations so… when interest rates begin to decline (i.e. bond prices moving higher) the natural upward bias for earnings coupled with expanding valuations from falling interest rates pushes stock prices higher.
In a deflationary trend prices are constantly being squeezed which, in turn, creates a negative drag in earnings growth. The only time the stock market moves higher is when cyclical growth is strong enough to push interest rates higher because during these time frames producer prices- and earnings- are expanding.
In any event… we digress. In 1981- 82 the SPX trended with bond PRICES. By 2000 the SPX was trending with bond YIELDS.
The peak for yields was reached in January of 2000. As yields turned lower the message was that cyclical growth had stopped expanding. The stock market continued to rise for an additional 9 months until the trend for equities swung lower to mirror the trend for yields.
The point is that in both instances the markets exhibited a 9-month lag. In 1982 the stock market did not turn higher until 9 months after bond prices had stopped falling while in 2000 equities continued to rise for 9 months after the bond market had ‘said’ that growth was beginning to slow.