Imagine that you have a position in a stock that has been trading back and forth between 10 and 20. Chart-wise if the stock breaks below 10 it will have taken out support and may move significantly lower. On the other hand if it pushes above 20 it might run all the way up to 30. We are, of course, merely pulling numbers out of the air here to help make a point.
So… what do you do with your long position when the stock declines back towards but through 10? Common sense suggests that one should either be a buyer close to 10 or a seller below 10 if support fails. Yet, human nature being what it is, the tendency is to sell on weakness just in case support does not hold. At the other end of the spectrum you will usually find traders buying aggressively when the stock approaches 20 just in case this time is different and it breaks to the upside.
Our point is… that it is difficult to avoid both fear and greed. At present the markets appear to be trading off of a healthy dose of fear- likely for good reason given the all too recent collapse during the second half of 2008.
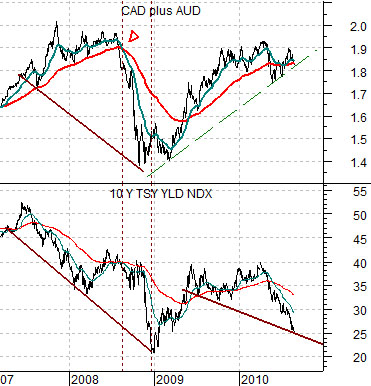
Below is a chart comparison between the sum of the Canadian and Australian dollar futures (CAD plus AUD) and 10-year Treasury yields.
Notice that yields ‘led’ the commodity currencies lower between 2007 and 2008. Month after month and quarter after quarter yields ‘said’ that growth was slowing even as crude oil futures prices soared upwards. The straw that finally broke the camel’s back occurred in mid-August when the commodity currencies finally buckled. We are focusing today on the point in time when the 50-day e.m.a. line crossed down through the 200-day e.m.a. line on or about August 14th of 2008.
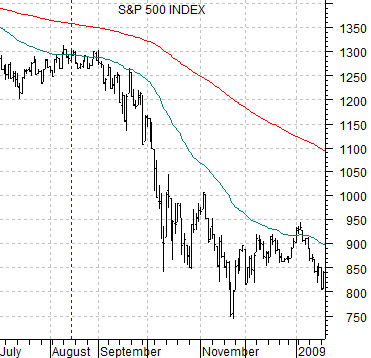
The chart at right features the S&P 500 Index through the second half of 2008. The argument is that even though the equity markets were under pressure into the late summer of 2008 the stuff didn’t hit the fan in earnest until mid-August. Between mid-August and late November the SPX declined from 1300 down to a low close to 750.
The argument today is that the moving average lines for the sum of the CAD and AUD have not yet ‘crossed’. They almost did so last month only to be rescued by U.S. dollar weakness and a rally in the Asian equity markets. To be fleeing the equity markets today may make perfect sense tomorrow, a week from now, or even next month but from this perspective it still looks like a rising trend fumbling with support rather than a collapsing trend similar to two years ago.
Equity/Bond Markets
We are going to drag forward the chart-based argument that we made on page 5 yesterday to give it another airing.
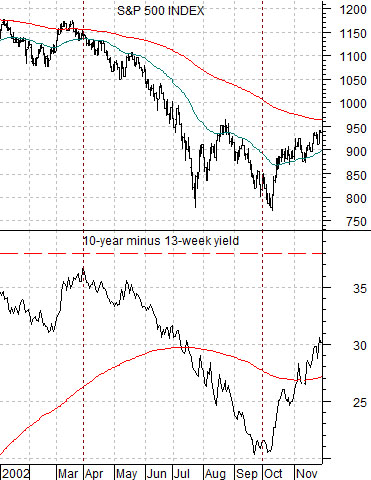
In some respects the current trend appears similar to 2002. In 2002 the spread between 10-year Treasury yields and 3-month TBill yields peaked around 3.7% at the end of the first quarter and then collapsed over the ensuing six months down to just above 2.0%.
This flattening of the yield curve due to falling long-term yields instead of rising short-term yields went with the final wave lower for the equity markets. The yield curve steadied out around the end of September with the SPX making its cycle bottom a week or two later in early October.
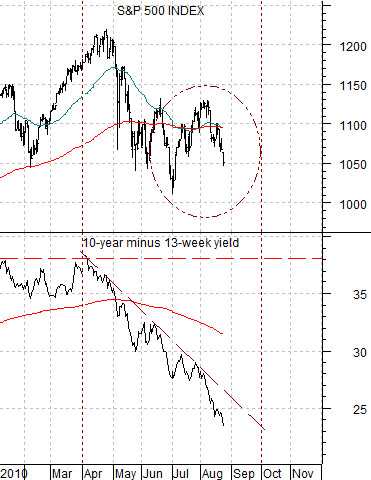
At bottom we show the current situation. The yield spread peaked around 3.8% at the end of March this year (very similar to 2002) and has spent close to 5 months grinding lower. If history were to repeat exactly the yield for 10-year Treasuries would squeeze down towards 2.1%- 2.2% over the next month to pull the spread back towards 2.0% given current TBill yields of roughly .15%.
So… based on the 2002 experience we should see ongoing pressure through the balance of the quarter with the SPX testing and possibly moving through the lows set at the end of this past June. The good news is that 1000- 1010 for the SPX is not as far away as it was only a few trading days ago.
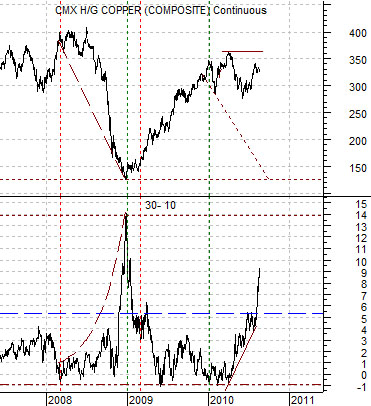
Below is a comparison between copper futures and the price spread or difference between the 30-year and 10-year Treasury futures.
The problem that we have at present is that the bond market is trading as if the world is coming to an end (notice the upward spike in the price spread similar to November of 2008) while copper prices hold near the highs. The bond market is ‘saying’ that copper might be better at 1.50 and copper is saying… that Asian growth is strong enough to shoulder the burden of a slowing U.S. economy.