We have been actively involved in the markets for more than 30 years and over that time we have periodically pondered rather odd little issues that have evolved from our various experiences. Without going through the bother of actually digging up accurate details we thought that we would attempt to create a chart-based depiction of one of the niggling thoughts that we have every year or two.
Let’s start with our premises: Stocks offer a higher return than cash. The comparison, however, has to be based on a major turning point for yields.
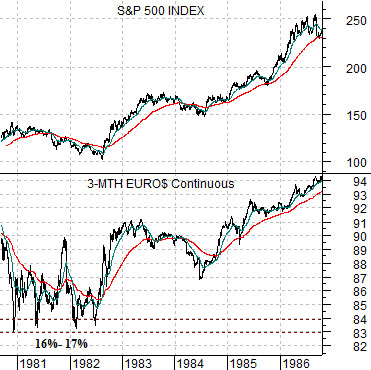
Just below is a chart of the S&P 500 Index and 3-month eurodollar futures from 1980 into 1996. From the end of 1980 into 1982 the yield on 3-month eurodollars (essentially similar to 3-month TBills) ranged as high as 16% to 17%. The idea is that from the cycle peak for YIELDS the return on the SPX should offer a higher long-term yield while also exceeding what could be earned in long-term bonds.
If memory serves in 1981- 82 30-year Treasury yields were roughly 14%- 15%. The long-term return on the SPX would be expected to somewhere in the same ball park which perhaps explains the ensuing 20-year bull market.
In any event… that wasn’t exactly our point. With the benefit of hindsight we can see that the turn from an inflationary and high-yield trend over to a disinflationary and falling-yield trend can carry the equity markets higher at an annual compound return consistent with the level of yields at the trend change date. Fair enough. What happens, however, when a trend changes from the absolute low point for yields in a deflationary trend? Does the argument work in reverse?
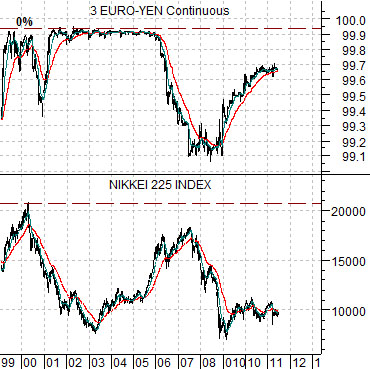
Next is a chart of 3-month euroyen futures (short-term Japanese yields) and the Nikkei 225 Index from 1999 to the present day.
Japanese short-term yields moved effectively to 0% in 1999- 2000 when the Nikkei peaked at just over 20,000. The argument is that the Nikkei should offer a return similar to what could be earned in cash or long-term bonds. Does that mean that an investor who bought the Nikkei at 20,000 more than decade or so back should expect to at least break even? If so, then eventually the Nikkei should double from current levels which, we will argue, is substantially more upside potential than one might expect from most other investment choices.
Equity/Bond Markets
As long as we are pontificating on quirky markets details we might as well return to the idea of ‘offsets’.
We do all kinds of charts based on one market divided by another or one market combined with another. From our perspective every price for every thing is based on some kind of ratio. By definition. A price is usually a function of what something is worth in terms of ‘cash’.
The problem is that investment decisions are not based solely on whether something is better than ‘cash’. You might buy a stock with cash and sell it and receive cash but in a world where the return on cash is virtually zero… most times the decision to own one thing depends on selling something else. Of, perhaps, not buying something else.
Should you own equities or commodities? If you are buying equities should you own a safe dividend payer or a go-go growth stock? Should you be long some currency other than the dollar? Would it make sense to be short one region and long another? Is gold stronger than oil? Are the grain futures and stocks a better choice than pharma? All of these choices are based on relative price action that may or may not have anything to do with the decision to own ‘stocks or cash’.
In our usual circular and confusing way… we return to the argument of offsets.
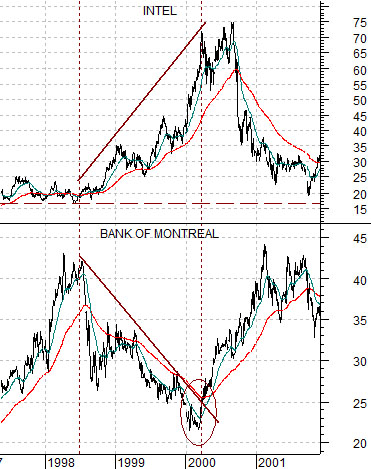
Below is a chart of Intel (INTC) as well as Canada’s Bank of Montreal (BMO) from 1997 into 2001.
In this example you can see that at any given time only one of these two was stronger and that when one was stronger the other was weaker. The trend change points in 1998 and early 2000 line up with key changes in the direction of interest rates. When yields were rising from late 1998 into 2000 the share price of Intel was stronger while money moved away from the banks. When Intel peaked the trend change was marked by a significant bullish shift in the trend for the share price of BMO. In other words… there were two ways to recognize that the Nasdaq’s trend was coming to an end in 2000. First, long-term yields turned lower. Second, the groups that had been declining as an offset started to pivot higher.
Whether this makes sense or not is open to debate but we have been using it as preamble to today’s point. If the ‘laggard’ stocks are in the process- right here and right now- of rather dramatically changing trend (from down to up) then what are the offsets?
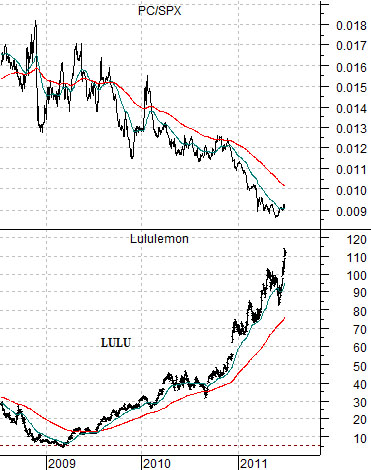
Next is a comparison between the ratio of Panasonic (PC) to the S&P 500 Index (SPX) and the share price of Canadian yoga wear maker Lululemon (LULU).
Our thought is that LULU’s parabolic price rise might be associated with the relentless downward pressure on short-term yields. In other words the lower yields go the more the markets fight for growth at any price. The reason yields are under pressure has to do with the negative trend for the laggards. If the laggards pivot upwards then this should mark some kind of major trend change for yields and, similar to Intel in the first half of 2000, the argument suggests that this could, in time, create a top for some the relative strength leaders coming out of early 2009. LULU is one example although we could also have shown something like NetFlix (NFLX).