Following 2 weeks away from the markets we return to find gold prices somewhat lower. So… this is where we shall start things off today.
Our view has been that gold prices have, by and large, been driven by three factors. Gold tends to rise when the U.S. dollar is weaker, it tends to do better than base metals prices when bond prices are rising, and it most definitely tends to do well when the major banks are at risk. In other words a perfect intermarket back drop for gold prices involves a weak dollar, strong bond market, and relative weakness by the Bank Index (BKX) compared to the broad U.S. equity market.
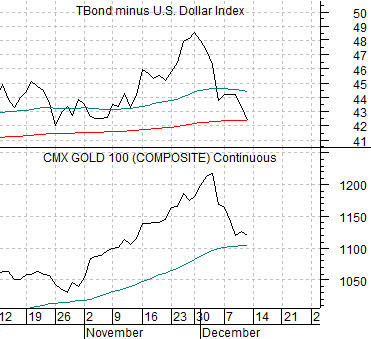
Immediately below we compare gold futures with the spread between the price of the U.S. 30-year T-Bond futures and the U.S. Dollar Index (DXY). At the end of last week the TBonds were just below 119 while the DXY was in the mid-76’s creating a spread of 42.33.
The point is that if gold rises with a weak dollar and stronger bond market then it will be under pressure whenever the dollar rises or the bond market becomes overly weak. Through the first two week of this month the spread between the TBonds and DXY has moved back to the down side resulting in a reasonably significant correction for gold prices.
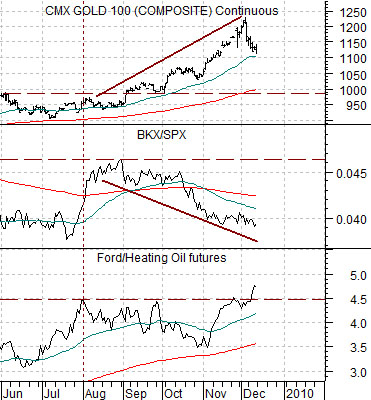
Below we compare gold futures prices with the ratio between the Bank Index (BKX) and S&P 500 Index (SPX) and… the ratio between Ford (F) and heating oil futures.
We have argued for the last year or so that the Ford/heating oil ratio (representing energy ‘using’ equity prices compared to energy-related commodity prices) should lead the equity markets through the recovery. The problem has been that the ratio has spent much of this year stuck below the initial recovery peak reached in late April.
The view was that once this ratio moved to new highs- either through strength in Ford or weakness in energy prices- it would lead to an extension of the recovery. An extension, by the way, that would rotate through into the banking sector.
So… when all was said and done… the combination of dollar strength and new highs for the Ford/heating oil ratio helped cap what appeared last month to be an end-of-year parabolic rally in gold prices.
Equity/Bond Markets
We are going to quickly run through three themes that we have been following over the past number of months.
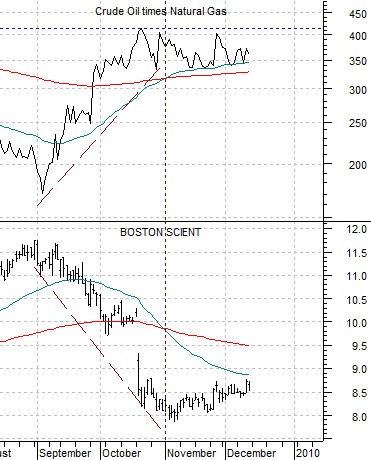
Below is a comparison between the share price of Boston Scientific (BSX) and the product of crude oil futures times natural gas futures.
The idea has been that BSX tends to trend higher when energy prices are flat to lower. We are using ‘oil times gas’ to represent the broader concept of energy prices.
At the start of November BSX began to rise. Slightly. In fact the pivot was so tepid that perhaps we should argue that it simply stopped falling but the thought was that it meant that energy prices had reached some sort of top. As the weeks slide by we can still see that the combination of oil times gas has not made new recovery highs since October.
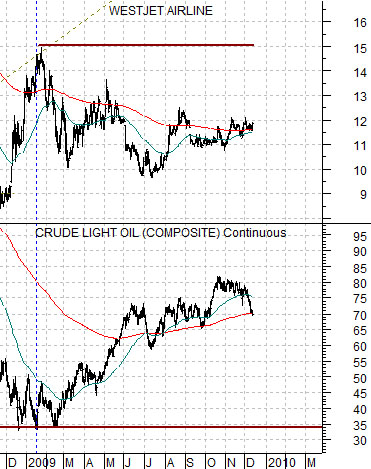
Below we compares crude oil futures with the share price of Canada’s WestJet (WJA). We are using WJA to represent the energy ‘using’ cyclical theme.
The chart suggests that for the past year the recovery in energy prices has acted as a negative for those sectors sensitive to fuel costs. The better the share price for WJA, however, the more compelling the argument that the blip above 80 for crude oil futures in October marked some sort of peak. What we would like to see is a nice close for WJA above roughly 12.50 (i.e. the August rally peak) along with a ‘cross’ by the 50-day e.m.a. line up through the 200-day moving average.
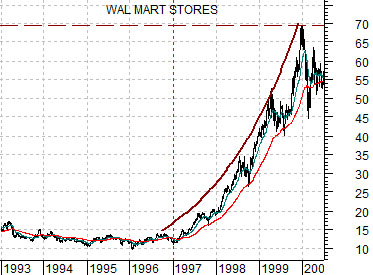
Below we have included a chart of Wal Mart. The chart runs from 1993 through into 2000.
We spend quite a bit of time working with the share price of WMT even though we rarely find reason to shop in one of their stores. Our fascination with WMT’s share price has to do with the historical tendency for WMT to start to ‘trend’ higher once the Asian and commodity themes begin to weaken. We will show another perspective on today’s third page but the point is that from 1993 through 1996 WMT’s stock price was literally dead in the water. Earnings were growing, sales per share were on the rise, and the dividend was being increased but the markets only began to take notice at the start of 1997 once crude oil prices began to weaken. When WMT starts to perk up- as it did towards the end of 2007 concurrent with the peak in the Asian stock markets- it tends to mean that something new has begun.