One of our views is that crisis markets come at the beginning or end of a cycle. They either initiate a bear market or mark the end of a bear market. They either precede a recession or come at the conclusion of a long period of capital outflows.
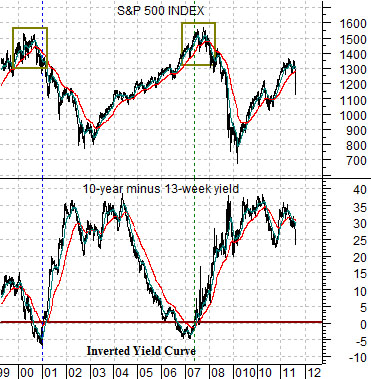
Below is a chart of the S&P 500 Index (SPX) and the yield spread between 10-year and 3-month Treasuries.
In 2000 and again in 2007 the yield spread went negative (i.e. fell below the ‘0’ line) as the yield curve inverted. An inverted yield curve has preceded each and every U.S. recession for the past number of decades (back into the 1960s if we recall correctly). It is true that inverted yield curves do not always lead to recessions but, then again, it has been quite some time since the last recession without a yield curve inversion.
The point is that equity bear markets through 2001 and 2002 as well as 2007 and 2008 make sense given the position of the yield curve. Such is not the case today. This has the feel of a liquidity-driven ‘crash’ similar to 1987 in some respects and 1998 which means a hard decline, a bit of sorting out, and at least the prospect of a fairly rapid recovery.
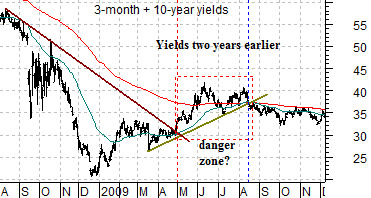
Below we have added a chart of the sum of 3-month and 10-year Treasury yields along with the SPX. We are showing the combination of short and long-term yields from 2008- 09 and comparing this to the equity markets today.
The idea is that the cyclical trend lags yields by 2 years. Falling yields today will help push cyclical asset prices two years from now while a rising trend for yields two years ago will weigh on the current trend for asset prices.
We won’t go into the details of this argument but suffice to write that we have done this one many times. The SPX rose through the end of last year in response- perhaps- to the falling trend for yields through the end of 2008.
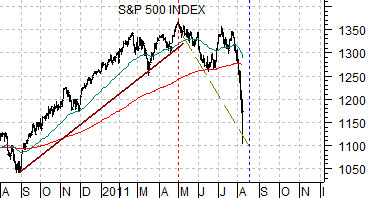
The charts suggest that there was a period of time between the end of April and early to mid-August- if the charts can be taken literally- that might show up as a ‘danger zone’. By the second half of this month the pressure from 2009’s rising trend for yields should have passed by indicating that the markets stand a good chance of steadying out fairly quickly.
Equity/Bond Markets
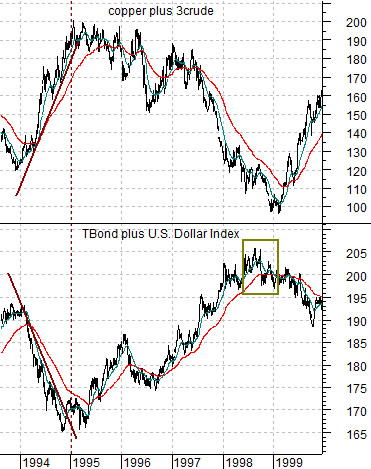
We wanted to take a quick run at explaining the comments that we made to begin the first page today. Just below is a chart comparison between the sum of copper and crude oil futures and the sum of the U.S. 30-year T-Bond futures and U.S. Dollar Index (DXY) from 1993 through 1999.
Strong copper and crude oil prices during 1994 went with falling bond prices and a weaker dollar. By the start of 1995 the dollar began to firm while the bond market turned higher and this marked the peak for copper and crude oil prices. It also marked the start of a directional flow for money as capital began to drain away from the Asian and emerging markets back into dollars, tech, and large cap consumer names.
The Asian crisis that swamped Singapore, Thailand, Indonesia, Malaysia, and the Philippines in the late summer of 1998 before sweeping through Russia and Brazil was the tail end of the trend change that began in early 1995. After more than 3 years of capital outflows one Asian market after another collapsed. In early 1999 the price of copper and crude oil bottomed and the trend shifted back in the other direction. The point is that ‘crises’ tend to occur after years of capital outflows and our sense is that we are going through exactly this with respect to the U.S. markets and dollar. On the other side of this- perhaps some time early in the new year- the dollar should turn sustainably higher.
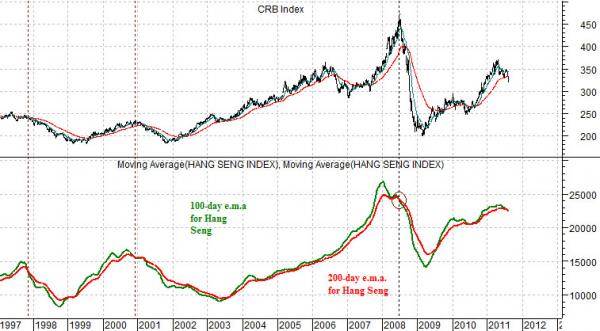
Time and time and time again we have underestimated the markets’ ability to swing back to the weak dollar/strong commodity/strong Asian and emerging markets themes. The argument has been that the CRB Index will remain in a positive trend until the moving average lines for the Hang Seng Index from Hong Kong ‘cross’ to the down side. The moving average lines are indeed in the process of ‘crossing’ and it will take a remarkable price rally in the very near term to alter the trend. If this isn’t the end of the commodity bull market then we stand to be much impressed by the speed with which the Hang Seng recovers. We shall see.