Our sense yesterday was that traders were trying to figure out whether weaker energy prices were a positive or a negative. A case can be made for either outcome (pages 2 and 5) but given that 2008 is still fairly close in the rear view mirror even the hint of downward pressure is enough to send stock index futures initially lower.
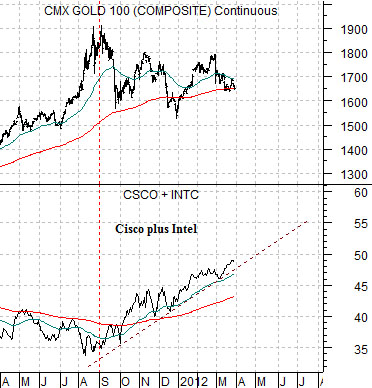
In any event… let’s start off with a chart of gold futures and the sum of the share prices of Cisco (CSCO) and Intel (INTC).
The chart shows that the trends are inverse. The chart shows that when gold prices started to trend lower last autumn the share prices of large cap tech stocks like Cisco and Intel began to rise.
So the point would be that regardless of what crude oil does or does not do… as long as gold prices are still trending gradually to the down side there isn’t much of a reason to start pitching stocks out the window in the race back to cash.
Now the situation would be different if, for example, the U.S. dollar started to tumble while bond prices soared (the most positive intermarket back drop for gold prices) but that hasn’t been the case. Especially for the dollar.
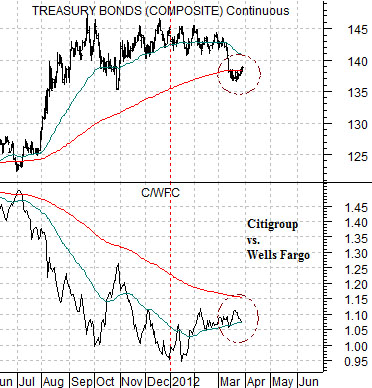
Next is a comparative view of the U.S. 30-year T-Bond futures and the ratio between Citigroup (C) and Wells Fargo (WFC). We use the C/WFC ratio to help mark the point in time when the recovery gained enough traction so that the laggard banks (C) began to rise against the healthier banks (WFC).
The argument here is that there is a fairly direct inverse relationship. When the laggard banks start to outperform the suggestion is that the trend for bond prices is ready to turn lower. We have also argued that the TBonds are following a similar path to both gold and the Japanese yen and both of these have recently been under pressure.
In yesterday’s issue we embarked on an explanation of the ‘rolling 3-year’ trend. The idea was that the kind of trend changes shown on the two charts on this page could last for as long as three years. Of course Cisco and Intel won’t rise in price every day and early in the pivot the C/WFC ratio will have a few storms to weather but… given that our short-term views are often longer than many traders long-term views these are the kinds of positions that we are willing to be patient with.
Equity/Bond Markets
So… are falling oil prices a positive or a negative for the equity markets? In truth we don’t know the answer to this one but, in general, energy price weakness has tended to put downward pressure on long-term yields.
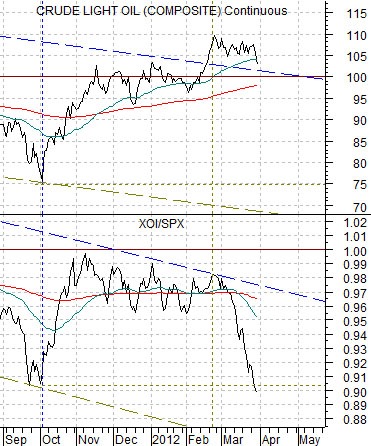
Just below is a chart of crude oil futures and the ratio between the Amex Oil Index (XOI) and S&P 500 Index (SPX). We have argued that the trends are usually quite similar, that it takes an XOI/SPX ratio above 1:1 to confirm or support crude oil in triple-digits, and that equities tend to ‘lead’.
So… are falling oil prices necessarily bearish? To the extent that the oil stocks tend to trend with oil prices the answer would be ‘yes’. To the extent that the oil stocks have already discounted a decline into the 75- 80 range the answer might be ‘not so much’.
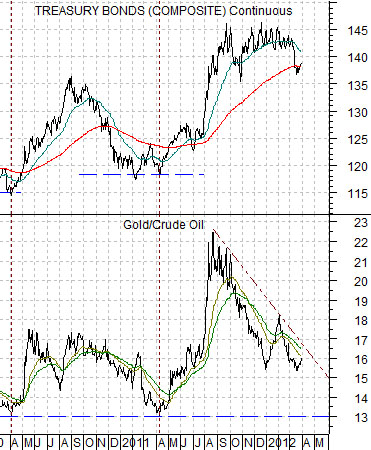
Next is a chart comparison between the U.S. 30-year T-Bond futures and the ratio between gold and crude oil.
The chart makes a few points. First, the gold/crude oil ratio tracks up and down with bond prices. Second, recent bond price bottoms have been made when the gold/crude oil ratio falls to 13:1. Third, the gold/crude oil ratio is nowhere near 13:1 so this likely isn’t a sustainable bond price bottom.
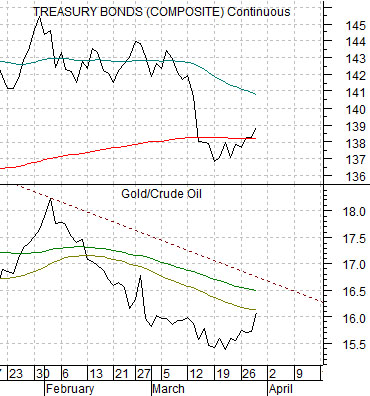
The problem with falling oil prices is that it tends to lead to a rising gold/crude oil ratio and a rising ratio goes with… rising bond prices. The shorter-term chart below makes the fairly obvious point that as long as oil prices are moving lower at a faster pace than gold prices the tendency is for bond prices to resolve upwards.
In a perfect world, of course, gold would move lower at a faster pace than crude oil but that was most certainly not the case in trading yesterday which helps to explain why bond prices were higher and yields were lower.