Nov. 4 (Bloomberg) — The Federal Reserve restated its intention to keep interest rates “exceptionally low” for “an extended period” and said the U.S. economy is picking up.
We are always impressed with the markets-related chaos that occurs following the release of the Federal Open Market Committee’s post-meeting statement. Analysts parse the wording frantically in search of a changed word or replaced sentence. The dollar and bond market swing wildly as the equity index futures trade back and forth as if something meaningful had just occurred. After a few minutes of volatility the trend resumes as traders shift their focus to the next piece of news.
Our point- and we actually have one today- is that what the Fed says or doesn’t say is almost irrelevant. The markets lead and the Fed follows so the Committee can issue a statement saying that it is going to raise, lower, or hold rates flat but ultimately what the Fed does will be determined ahead of time by the marketplace.
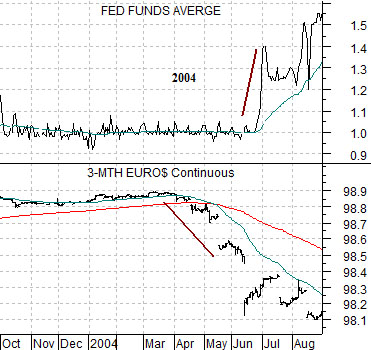
To explain… we show below the Fed funds rate and 3-month eurodollar futures from October of 2003 through August of 2004. The time period in question includes the first Fed rate hike in June of 2004 following the series of rate cuts that began in January of 2001.
The chart shows simply and somewhat elegantly that the Fed did not raise the funds rate until the market told them that it was time to do so. The way the market does this is by raising short-term interest rates. When 3-month eurodollar futures prices began to tumble in April and May of that year the message was… it is time for the Fed to start raising rates. Fair enough.
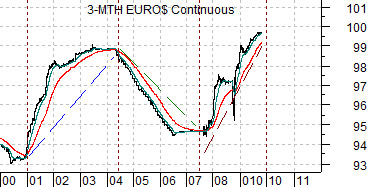
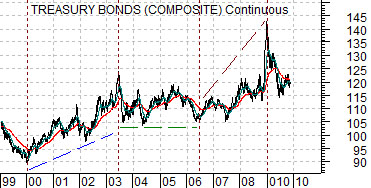
So… if the Fed follows the market with the first rate hike due a month or two after 3-month eurodollar futures prices begin to decline… the focus of our concern has to be on when exactly 3-month eurodollar prices will start to fall. Below right we compare 3-month eurodollars with the 30-year T-Bond futures. The twist is that the charts have been offset by exactly one year.
In general the long end of the bond market has been leading the short end by very close to twelve months. Since the TBonds peaked in price in December of last year the argument would be that the short end of the bond market could start to decline around the end of this year with the Fed tagging along some time between the end of January and the middle of next March.
Equity/Bond Markets
We are going to push forward the argument that we have been showing on page 5 over the last week or so. Just for a change of pace.
The current or recent trend feels a bit too much like a game of musical chairs. Traders pushes prices further and further along the trend until a scramble develops as money heads back towards safety. When the dust settles we find that the music is still playing so the trend continues.
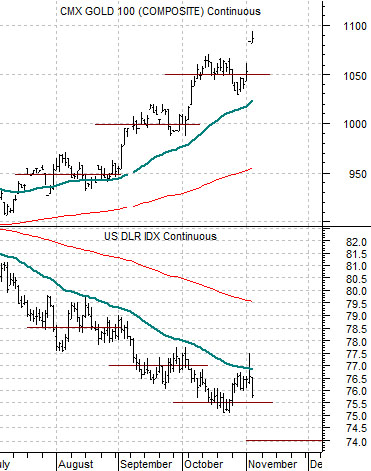
Below is a comparison between gold futures and the U.S. Dollar Index (DXY) futures. The current trend includes rising gold prices and a weaker U.S. dollar. Over the past few months gold prices have been rising in 50-point increments with the lion’s share of the grains coming at the start of a new month. An ongoing trend would involve dollar weakness and a push from 1050 up to around 1100 for gold.
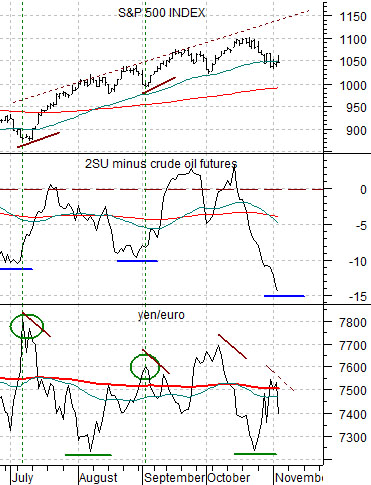
If the trend has not changed then the chart below right makes some sense to us. The chart compares the S&P 500 Index (SPX) with the spread or difference between 2 times the share price of Suncor (SU) and crude oil futures (the premise is that SU tends to be ‘fair’ at 50% of the price of crude oil. When it gets too far below ‘fair’ it means that either equities are too low or crude oil is too high) along with the cross rate between the yen and the euro.
The argument is that once the SU- crude oil spread falls to or below -10 AND the yen/euro cross reaches a peak… the stock market is set to rally. Such was the case in early July and in early September. Perhaps this is an ‘every second month’ cycle…
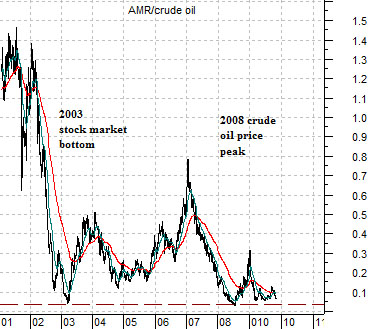
Below we return to a big picture or macro view. The chart consists of the ratio of the share price of airline AMR to crude oil futures. The airlines tend to trend- at least in terms of relative strength- inversely to energy prices.
The AMR/crude oil ratio has hit bottom on two occasions this decade- at the stock market’s lows in early 2003 and at the commodity market’s highs in mid-2008. The closer the ratio gets to the old bottoms the more we ponder whether the next test will involve a cycle-ending peak for crude oil prices or the start of a lengthy equity bull market.
