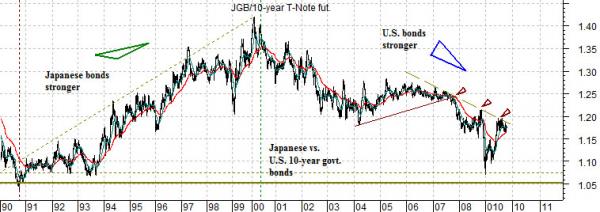
The chart below shows the ratio between Japan’s 10-year bond futures (JGB) and the U.S. 10-year T-Note futures from 1990 to the present day.
Quickly… the argument is that following the peak for Japanese growth in 1990 the Japanese bond market lifted relative to U.S. bonds for the next decade as Japanese short-term interest rates moved down towards 0%. The peak for U.S. growth occurred ten years later at the highs for the Nasdaq in 2000. This marked the start of a cycle that ultimately brought U.S. short-term yields down to 0% in 2008.
We have argued that while U.S. and Japanese short-term yields have converged near 0% the markets are working through a series of crises in an attempt to bring long-term yields into line. With Japanese 10-year yields at or near 1.35% and U.S. yields closer to 3.35% this requires either upward pressure on Japanese yields or downward pressure on U.S. yields.
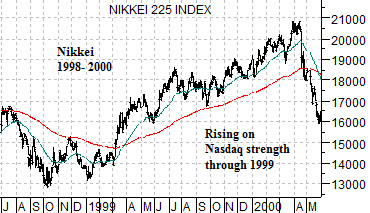
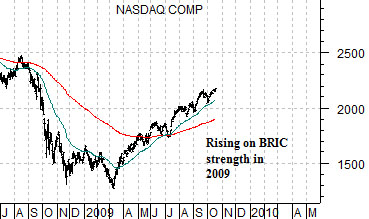
In a sense, however, the argument is that the Nasdaq today (10 years after the peak) is similar to the Nikkei in 1999. In the midst of a prolonged economic slow down the Nikkei rose steadily through 1999 as the Nasdaq created enough cyclical growth to lift all boats. This year’s rising trend in the Nasdaq may well be simply an extension of China’s race to become the next asset price ‘bubble top’. If so… then expect the equity markets to surprise to the upside for another quarter or two.
Equity/Bond Markets
If we compare the U.S. today with Japan back in 1999 we end up with two conclusions. First, the stock market’s rally ‘makes sense’ as long as the cyclical driver pushing prices higher remains intact. The Nikkei did not turn lower until the Nasdaq had completed its run into 2000.
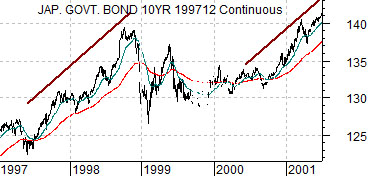
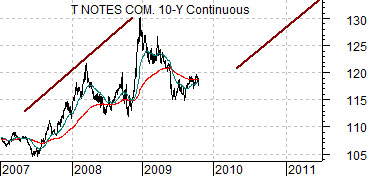
The argument also does a nice job of explaining what the bond market has been doing this year. Below we compare the JGB 10-year futures from 1997 into 2001 with the U.S. 10-year T-Note futures from 2007 forward.
The idea is that rising Japanese bond prices from 1997 into the Asian crisis in late 1998 is ‘similar’ to the strong trend for U.S. Treasuries from 2007 into 2008’s sub-prime crisis. The lack of bond price weakness through the second half of 2009 could best be explained by the assertion that a market that will not go down on bad news (in this case cyclical strength) is merely awaiting an opportunity to resolve higher. Once the cyclical driver- most likely related to the BRIC theme- begins to wane the bond market could push on to new price highs some time later next year.
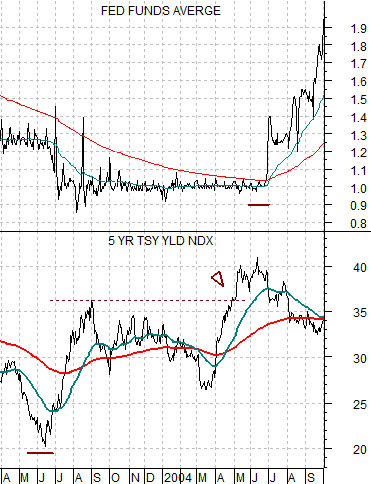
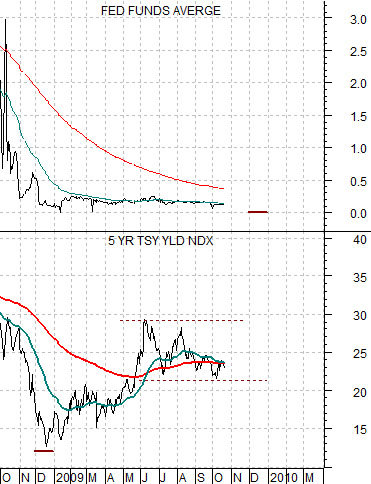
Below are two comparisons of the Fed funds target rate and 5-year Treasury yields. The top chart is from 2003- 2004 while the lower chart is from the current time frame.
The low point for 5-year yields was reached in June of 2003. The Fed began to raise the funds rate almost exactly one year later in 2004. With the bottom for 5-year yields having been reached in December of 2008 the argument would be that the first Fed rate hike could be due towards the end of the year. The key- and this is likely the important point- would be new highs for 5-year yields in the interim.
IF 5-year yields push above 3% over the next few months THEN the Fed will respond by raising the funds rate. IF our comparison to Japan prove to be accurate THEN 5-year yields are unlikely to make new highs suggesting that while the Fed may raise the funds rate some time in 2010 the subsequent collapse in asset prices will bring it back to 0% in short order.