Through trading yesterday no major trend had clearly changed. The dollar has shown some life and the long end of the Treasury market has bounced offset by minor weakness in metals prices, the commodity currencies, and the share prices of the commodity producers but even we would be hard pressed to call this much more than a correction. Our view is that the trend will change as we move into the third quarter but that will take both more time and more work.
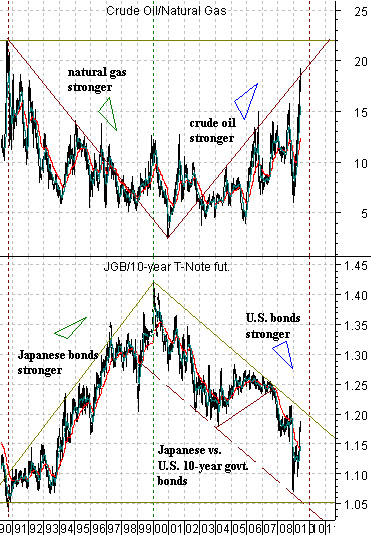
We are going to start off with a ‘macro’ perspective today. The chartbelow compares the ratio of crude oil to natural gas with the ratio between Japanese and U.S. 10-year bond futures from 1990 up to the present day.
The argument is that even as the markets work through unprecedented times fraught with unanticipated bubbles and crises there is an underlying ‘driver’ at work. In other words relative prices are being forced in certain directions over the longer-term.
The sequence may or may not have started back in 1990 at the peak for Japanese asset prices but that is where our story begins. In 1990 the Japanese 10-year (JGB) bond futures bottomed relative to 10-year U.S. T-Note futures. In other words this marked the point in time when Japanese long-term interest rates were at a high relative to U.S. interest rates and this went with a price ratio between crude oil and natural gas in excess of 20:1.
Roughly 10 years later- in 2000- the Japanese bond market reached a peak which means that this was the low point for Japanese yields relative to U.S. yields. Concurrent with this natural gas prices reached a high relative to crude oil prices.
The chart argues that from 2000 into 2009 the underlying trend has been pushing U.S. bond prices higher relative to Japanese bonds and natural gas prices lower relative to crude oil. In other words after a decade of decline for Japanese yields through the 1990’s the markets have been squeezing U.S. yields down to Japan’s levels. Keeping in mind that economic strength tends to go with falling bond prices and rising yields… notice that each time the JGB/T-Note ratio gets ‘too high’- as it did in 2000 at the Nasdaq’s peak and in 2007 just before the financial crisis began to develop traction- economic growth is forced lower.
Our point is that as long as the crude oil/natural gas ratio is on the rise the underlying trend has not changed and given that the underlying trend tends to include stronger U.S. bond prices the unexpected outcome will tend to favor slower growth and rising Treasury prices.
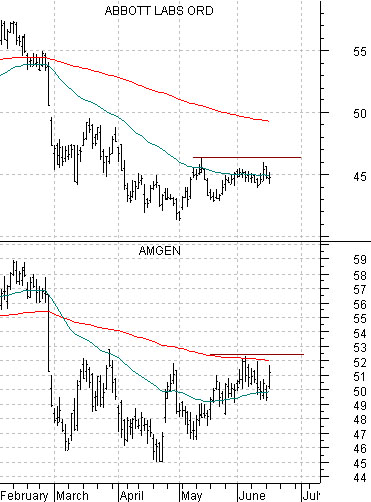
Belowwe show Abbott Labs (ABT) and Amgen (AMGN). We are watching ABT because it tends to rise when the cyclical trend begins to weaken and we are following AMGN because it tends to push above its 200-day e.m.a. line when the dollar begins to firm. Both stocks have been a bit better recently but neither has done enough to suggest that the weak dollar/weak bond market/strong commodity trend has changed.
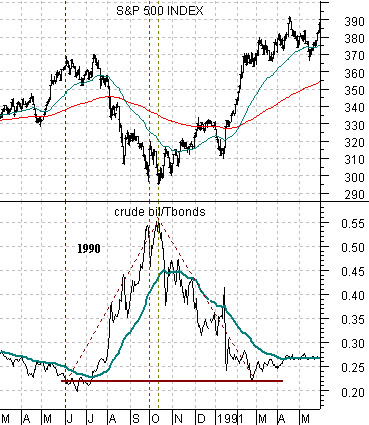
Below we show a chart from 1990- 91. The argument is that the low point for the S&P 500 Index (SPX) during the 1990 bear market was reached at the peak for the ratio between crude oil and long-term Treasury prices. With oil prices strong and bond prices weak over the past while the markets are creating at least the potential for a trend change similar to 1990 this summer.
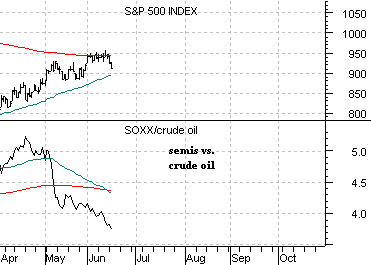
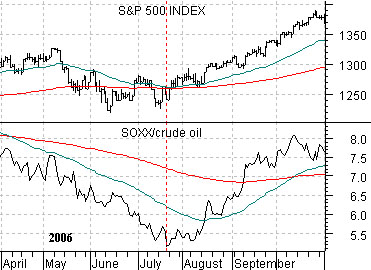
Below are two chart comparisons between the SPX and the ratio between the Philadelphia Semiconductor Index (SOX) and crude oil futures. The top chart is from 2006 while the lower chart is from the current time frame.
We argued recently that the U.S. equity market is not in a positive or bullish trend UNLESS the semiconductors are rising relative to crude oil prices. While the SPX has approached its moving averages from below instead of from above- as was the case in 2006- the idea is that this index will not lift up from its 200-day e.m.a. line until the SOX/crude oil ratio has bottomed and begun to push upwards.