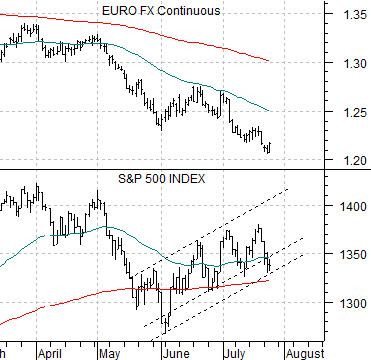
The euro rallied yesterday and in response the equity markets stopped declining. At right is a comparison between the euro futures and the S&P 500 Index. We have shifted the chart comparison between the TBond futures, German bund futures, Japanese yen, and SPX to page 5 for a change of pace.
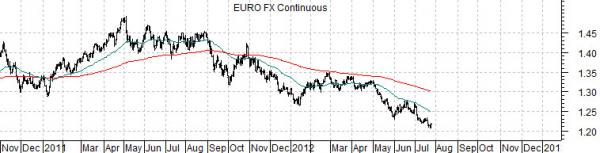
The interesting thing about the way the stock market has apparently locked on to the trend for the euro is that the chart of the euro this year is almost ‘dead’ on that of the U.S. Dollar Index from 2011.
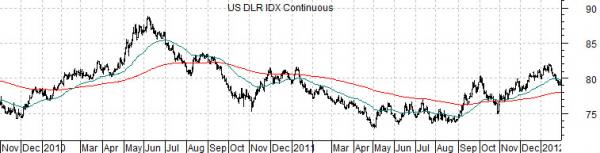
Below are charts of the euro futures from late 2010 to the present day and the U.S. Dollar Index futures from late 2009 into January of 2012.
The point? If the euro follows a similar path then an August bottom looks appropriate with a gradual recovery pushing the currency higher through year end. If a better euro is viewed as a positive for equity and commodity prices then perhaps a more bullish trend is on the near horizon.
Equity/Bond Markets
Last week the number of Americans seeking unemployment benefits jumped from 352,000 up to 386,000. The buzz following the number was that this was due to seasonal factors. Still… it represented the biggest increase since April of 2011.
The argument is that the weekly U.S. jobless claims number has to drop below 350,000 before it will start to create the kind of traction within the labor markets that will lead to a lower unemployment rate. Whether 350,000 is a true ‘line in the sand’ or not is another issue but the reality is that the unemployment rate has not shown improvement following the last recession and… weekly jobless claims have not declined below 350,000.
The point is that today is Thursday and on Thursday we get the weekly jobless claims report. If the number declines below 350,000 one of these weeks or months we would expect to see a bearish response from the bond market and offsetting strength from equities and commodities. On the other hand if the number continues to ramp higher then we might be in for a difficult next month or two.
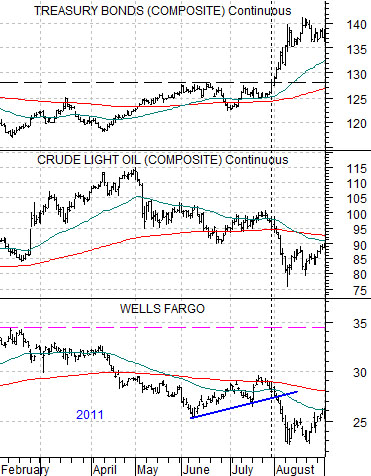
We are going to take another run at an argument that we made on the fifth page yesterday. At top right is a chart comparison from 2011 of the share price of Wells Fargo (WFC), crude oil futures, and the U.S. 30-year T-Bond futures.
In late July of 2011 the TBond futures broke up through price resistance around the 128 level. The sharp rally in bond prices went with equally sharp declines for crude oil and Wells Fargo.
In a matter of a couple of week the price of crude oil fell from around 100 down to intraday levels below 80 (roughly 20%) while Wells Fargo moved from 29 to 23 (also about 20%). The end result of a break to new highs for the bond market was a 20% hair cut for growth-oriented asset prices.
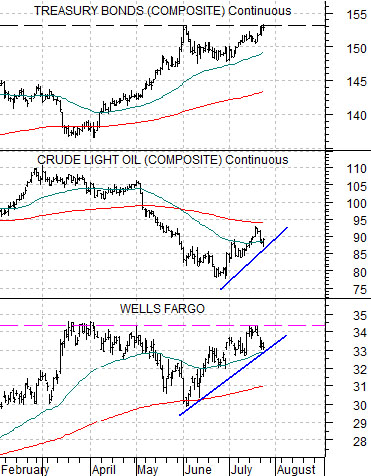
Below is the same comparative view for the current time frame.
The most important detail on this chart would be the resistance line just over 153 for the TBond futures. Notice as well that from the time the TBonds first hit 153 at the end of May the share price of WFC began to rise from 30 to recent prices just over 34.
The basic argument here is that the TBonds are into price resistance close to 153. If the bond market declines then equity and commodity prices should move upwards. If, on the other hand, the bond market punches to new highs- similar to the last few days of July in 2011- then there is a very good chance that downward pressure on the equity and commodity markets will accelerate through the first half of August.
One of our views has been that economic weakness is coming from Europe and Asia while offsetting strength is emanating from an improving U.S. economy. The problem is that every time U.S. jobless claims stop showing an improving trend the markets become swamped by negative news from abroad. So… will today be the day when the bond market sags in response to the jobless claims numbers or are we destined to follow a similar path to 2011 with asset prices weakening on bond market price strength with a pivot back in the other direction due around the start of this year’s fourth quarter?