On any given day strength or weakness in commodity prices can always be explained in some way by ‘the news’. The end of last week, however, seemed somewhat contradictory as traders apparently added to bullish commodity bets to take advantage of global growth even as energy prices weakened in response to a tepid U.S. economy.
June 6 (Bloomberg) — Funds boosted bets on rising commodity prices to the highest in four weeks, led by copper, amid signs that the global economic recovery will remain resilient and boost demand for raw materials.
June 3 (Bloomberg) — Crude oil fell, capping the biggest weekly decline in a month, as the U.S. jobless rate climbed to the highest level this year, adding to concern that a slower economic recovery will curb oil demand.
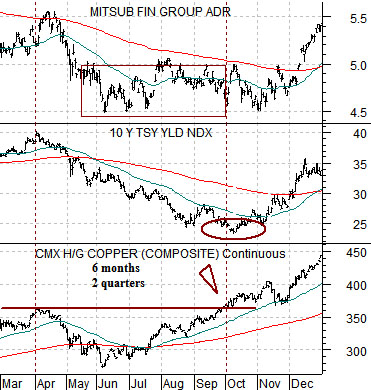
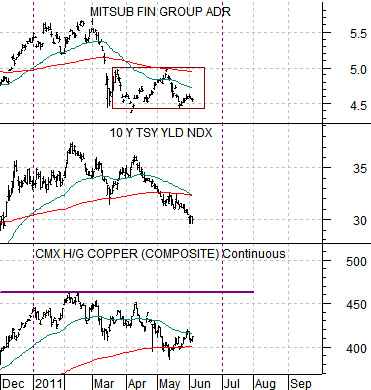
Below is a chart comparison between copper futures, 10-year U.S. Treasury yields, and the share price of Japanese bank Mitsubishi UFJ (MTU) from 2010 while below is the same comparison from the current time period.
For good or for bad the markets have reverted in recent days to the ‘weak U.S. dollar and strong copper’ relationship. While many worry about problems in the Eurozone and Middle East along with stagnant U.S. employment growth the markets appear determined to at least take a run at using a weaker U.S. dollar to lever up copper futures prices.
The argument has been that in 2010 yields and the laggard banks (MTU) peaked and turned lower as soon as copper prices began to weaken. As copper prices broke to new highs following a six-month consolidation at the end of September the trend for yields swung back to the upside followed a few weeks later by the cyclical banks.
We can make a case for the current correction starting in January although the chart below seems to suggest that February is also an option. Our thought, however, is that if the markets continue to show the kind of paucity of imagination that allows for a virtual repeat of 2010’s recovery trend… then look for copper futures to make new highs some time over the next month or two. If copper makes new highs then yields should swing upwards once again as money shifts aggressively back into the cyclical growth themes.
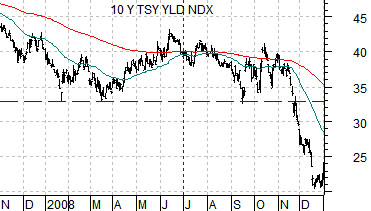
One of our views is that 2011 is actually the ‘inverse’ of 2008. We have argued that instead of dollar AND bond price strength we could get a stronger dollar with falling bond prices and rising yields.
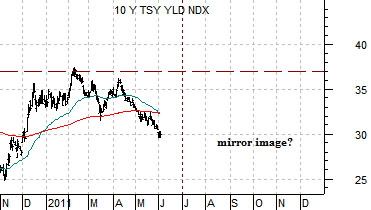
The charts below compare 10-year Treasury YIELDS from 2008 as well as 2011.
The idea here is that yields ROSE into June of 2008 and are FALLING into June of 2011. If this particular argument plays out look for a return to rising yields during the second half of this year.
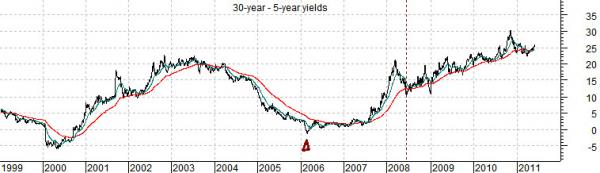
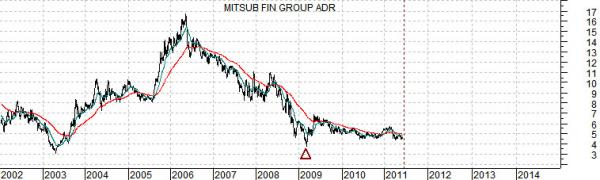
We thought that we should return to one of our favorite lagged relationships. Below is the comparison between the share price of Mitsubishi UFJ (MTU) and the spread between 30-year and 5-year Treasury yields. Notice that the charts have been shifted or offset by exactly 3 years.
We continue to focus on this relationship because… it keeps working. The low point, for example, for the yield spread in 2000 lines up with the bottom for the equity markets (and MTU) in 2003 while the yield spread’s peak in 2003 lines up with top for MTU in 2006. The absolute bottom for the yield spread in 2006 lines up exactly with the bottom for MTU in 2009… and so on.
The argument has been that the yield spread corrected quite sharply during the first half of 2008 and the ‘echo’ of this move might be impacting the cyclical trend through the first half of 2011. So far the idea remains that corrections will resolve to the upside with at least the potential for a cyclical top some where out in the second half of 2013.