We thought that we would end off the week with a bit of a chart-based exploration of the 2-year lag.
We have been working with the thesis that the cyclical trend lags behind changes in interest rates for well over a decade and while we often feel that it has to be little more than coincidence… it has worked so well for so long that we are inclined to believe that there is something about it that simply works.
The idea is that monetary policy works with a lag. When the Fed reacts to weakness by easing credit conditions a reasonable period of time passes by before the stimulus finds traction. Conversely when the economy is so strong that the Fed feels the need to pull back on the reins by tightening credit it takes a fair length of time before the cyclical trend begins to weaken.
In any event… it has been our experience that the cyclical trend lags behind changes in interest rates by very close to two years. Hence… the 2-year lag.
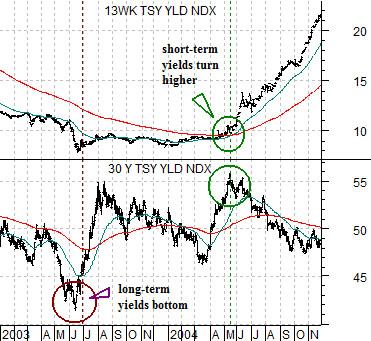
Below we show a comparison from 2003- 04. The chart consists of 3-month TBill yields and 30-year Treasury yields.
Another argument would be that the bond market leads the equity market which, in turn, leads the Fed. The Fed will not cut the funds rate until well after long-term yields begin to decline and it will not raise the funds rate until a year or more after long-term yields begin to rise.
The low point for 30-year yields was reached in mid-2003 with short-term yields swinging higher close to a year later in the second quarter of 2004. We have argued that when the Fed starts to raise the funds rate the initial reaction in the long end of the Treasury market is for yields to decline- which is what happened through the second half of 2004.
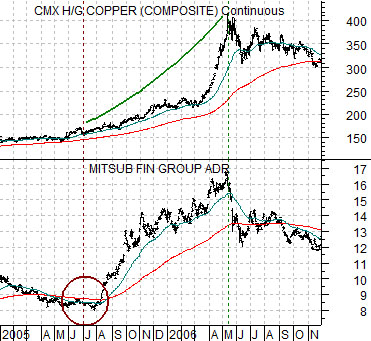
Further below is a chart of copper futures and Japanese bank Mitsubishi UFJ (MTU). This chart shows the time frame from 2005 into 2006. The point is that there was a very powerful cyclical price surge from mid-2005 (two years after the lows for long yields) into the spring of 2006 (two years after the start of rising short yields). The cyclical trend represented by copper futures prices and Japanese equities reached a top two years after the initial rate increase by the Fed.
Equity/Bond Markets
The point that we were attempting to make on today’s first page was that the cyclical peak for asset prices may not be reached until two years after short-term yields start to rise. Of course a case can be made that China began to tighten credit in October of last year but… even so… that puts the end of the cyclical rally way out in the autumn of 2012.
Another point was that one of the strongest and most concentrated periods of strength occurred between the two year anniversary of the low point for long-term yields and the similar anniversary of the onset of a rising trend for short-term yields.
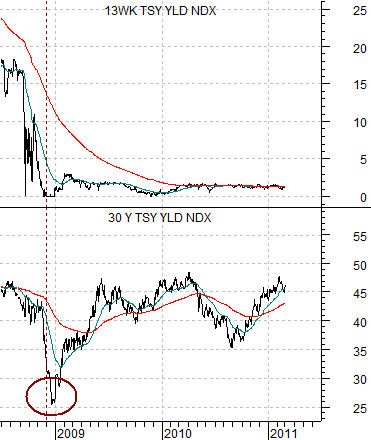
Below is a chart comparison between 3-month TBill yields and 30-year Treasury yields for the current time period.
The chart shows that long-term yields bottomed around the end of 2009 while short-term yields have yet to turn upwards.
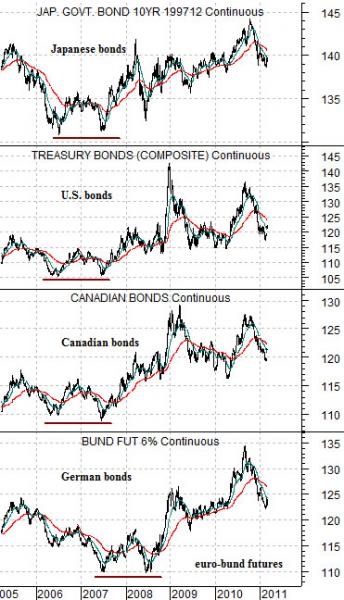
Below we have included a chart of Japanese, U.S., Canadian, and German bond futures. The chart suggests that the true peak for long-term bond prices may have been reached in 2010 instead of the end of 2008. Obviously long-term Treasury YIELDS bottomed at the end of 2008 but Japanese and German yields did not hit a low until some time between August and October of last year.
The problem with the two year lag is that it relies on what the bond market was doing two or more years ago. Given that a low point for yields in 2010 won’t be impacting the cyclical trend until 2012 we are going to have to work with what we have so far.
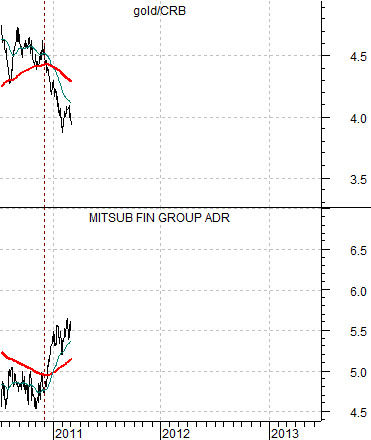
Below is a chart comparison between the share price of Mitsubishi UFJ (MTU) and the ratio between gold and the CRB Index. Note that this chart has been lagged or offset below the top chart by two years.
The argument is that the cyclical trend from 2005 into 2006 was lagging the low point for long-term yields in 2003 and the start of rising short-term yields in 2004.
In the current cycle if the low point for long-term yields was reached at the end of 2008 and we have not yet reached the start of a rising trend for short-term yields (although the European Central Bank has indicated that this process may start as early as next month) then we are in a similar position to 2005- 06.
Circling back once again the idea is that concentrated strength should have begun during the fourth quarter of 2010 (a two year lag to the low point for long-term yields) with the cycle top due some time either late in 2012 (based on China) or early in 2013 (assuming the ECB raise rates in April).
Note that we are using MTU as our indicator of the cyclical trend with the gold/CRB Index acting as confirmation. In a perfect world the better the laggard banks do the lower gold prices should move relative to the CRB Index.