Sept. 2 (Bloomberg) — U.S. stocks rose, adding to the biggest rally in the Standard & Poor’s 500 Index since July, and Treasuries fell as an unexpected jump in home sales and a drop in jobless claims tempered concern the economic rebound is weakening.
Sept. 2 (Bloomberg) — The dollar fell against 13 of its 16 major counterparts after pending U.S. home resales unexpectedly rose, signaling the housing market may start to stabilize and boosting investor appetite for higher-yielding assets.
We have argued for some time that there are two major ‘drivers’ that would lead to higher equity prices- a weaker dollar and a weaker bond market. Over the past two trading sessions the dollar and the bond market have declined in price with equities rising.
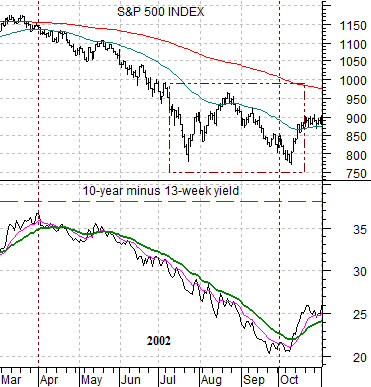
Below is a chart comparison from 2002. We show the S&P 500 Index (SPX) and the spread between 10-year Treasury yields and 3-month TBill yields.
The stock market made a number of bottoms between mid-2002 and March of 2003 but one of the major ones was associated with the low point for the yield spread around the end of September.
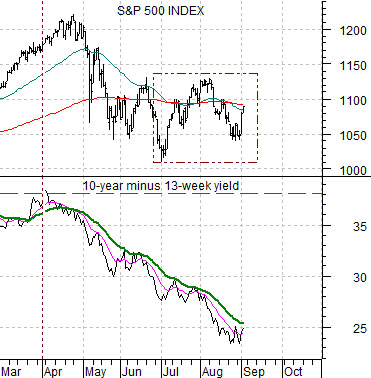
Next is the same chart comparison for the current time period.
The argument is that while the stock market can make a bottom- as it did in July of 2002- with the yield spread falling a sustainable bottom will likely require an upturn in the spread. The yield spread has risen on quite a few occasions over the past three months only to roll back to the down side once again. In terms of the two moving average lines shown on the chart something north of 26 (10-year yields more than 2.6% higher than TBill yields on a closing basis) would likely mark the end of the falling trend.
For those inclined to be bearish we can understand the reluctance to feel positive at this time of year. In 2002, for example, the trend ran right through the end of the quarter before pivoting upwards in October. We suspect that there is a fairly broad anticipation that prices will be a lower a month from now leaving many on the sidelines awaiting a better entry point. The problem is… if our work is correct… there may not be a better entry point. This could, in fact, be the last and best chance.
Equity/Bond Markets
All of this brings us back to the 2-year lag. The argument once again is that cyclical growth lags changes in interest rates by very close to two years. Sharp declines in yields through the second half of 2008 are now starting to impact the cyclical trend. Given the fact that the focus of downward pressure on the equity markets since the end of the first quarter has been on the cyclical themes… perhaps we are on the right track here.
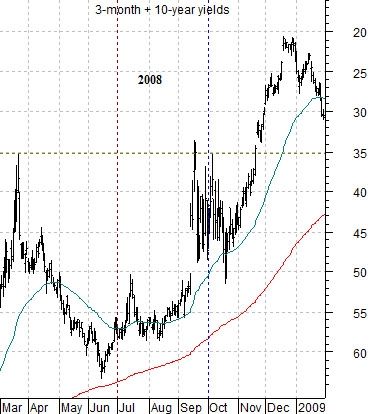
Below is an upside down chart of the sum of 3-month and 10-year Treasury yields. We have scaled the chart in this manner so that it moves ‘with’ the equity markets. In other words falling yields lead to rising stock price and vice versa.
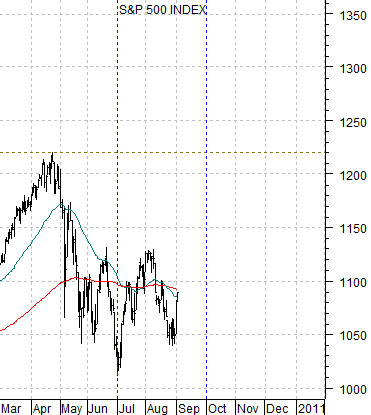
Below is a chart of the S&P 500 Index. The yields chart is from 2008 while the SPX is from 2010 to account for the 2-year lag.
The point is that if this worked perfectly… there would be a sell off in cyclical asset prices through the second quarter of this year leading into a recovery that would gather momentum some time close to September with an upside push into year end.
The thought is that this particular ‘picture’ is wholly at odds with the expectation that prices will be lower into October. They may be, of course, but then again the train may already have started to leave the station.
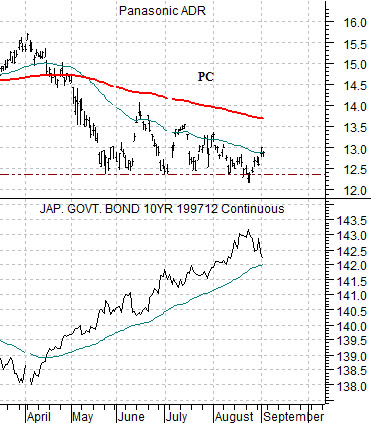
Below is a comparison between Panasonic (PC) and the Japanese 10-year (JGB) bond futures.
The simple point is that a broad rebound in cyclical asset prices requires- absolutely requires- falling bond prices. The JGBs have to break the rising trend… which has happened as of yet.