On the one hand the damage to asset prices- so far- in 2011 has been significantly less than it was back in 2008. On the other hand a case can be made that the pressures within the markets are almost exactly the same as the very worst point in time in December of 2008.
The bad news is that if this is going to get worse the waterfall should begin from current levels. The good news is that if this isn’t going to get worse then we should be very close to the lows.
Now… let’s explain what we mean by all of this.
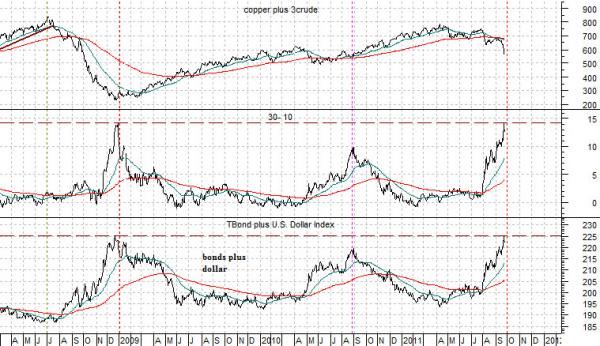
Below is a rather large chart comparison between the sum of copper and crude oil (copper in cents plus 3 times crude oil in dollars), the price spread or difference between the 30-year and 10-year Treasury futures, and the sum of the U.S. 30-year T-Bond futures and the U.S. Dollar Index.
In this example copper and crude oil represent on of the facets of the cyclical trend. The 30- 10 bond price spread represents upward pressure on the bond market as money moves towards safety. The sum of the TBond and Dollar is another measure of capital fleeing risk.
At the very worst point in time close to the end of the fourth quarter of 2008 the spread between the 30-year and 10-year Treasury futures widened out to just over 14 points. At the same time the combination of the TBonds and Dollar rose to around 225. This essentially marked the lows for the cyclical trend with the ensuing recovery driven by money moving slowly back into the emerging markets themes.
As of last week the 30-10 spread had once again spiked to around 14 while the sum of the TBond and Dollar had moved to 225. These two measures argue that conditions at the end of this year’s third quarter are almost exactly as bearish as they were at the end of 2008. All things being equal (and they never are) a spike to new highs by both the 30-10 and TBond plus Dollar would argue for a ramp up to a whole new level of markets-related crisis.
Equity/Bond Markets
The above point was that the markets that act as offsets during periods of crisis (namely the dollar and Treasury market) have recently risen to the highest levels since the end of 2008. Over the past couple of trading sessions the bond market has begun to weaken somewhat suggesting that a fairly significant ‘line in the sand’ has been reached.
A bearish outcome would likely go with an upward spike to new highs by the 30-10 spread and continued strength in both the dollar and TBonds. A bullish outcome- similar to yesterday- would involve the bond market fading lower with the dollar flattening out somewhat. Our view favors the bullish outcome but it makes sense to at least consider what might happen if we prove to be… wrong.
We are going to return to an argument that we have made on a number of occasions in recent weeks. The idea is based on the ratio between the S&P 500 Index and the U.S. 30-year T-Bond futures.
In extreme situations money moves out of equities and into bonds… in a hurry. This pulls the SPX/TBond ratio sharply lower.
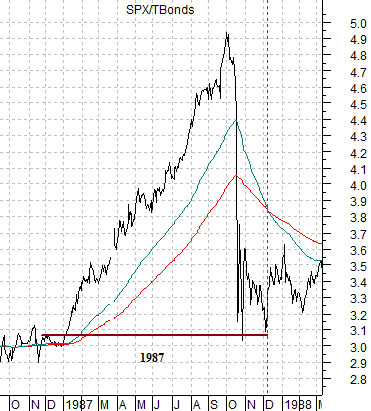
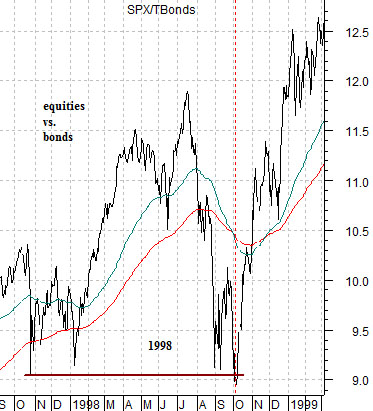
The premise is that the SPX/TBond ratio will find support once it has declined back to year-ago levels. The chart below shows that in 1987 the ratio snapped back to the levels last seen around the end of 1986. The next chart shows 1998’s Asian crisis. Once again the equity/bond ratio found support in October of 1998 around the levels of October 1997.
In both cases the ratio declined, bounced, and then made a second low a month or so later.
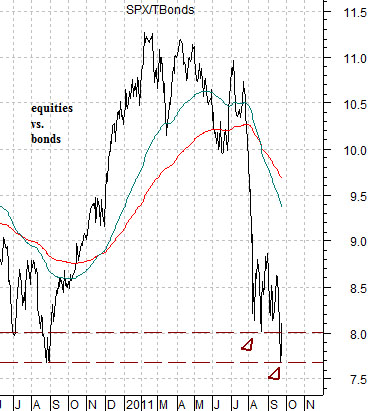
The last chart below shows the current situation. We will argue that everything that needed to be done to complete the correction has now been accomplished.