WASHINGTON (AP)- U.S. companies in March posted the highest number of job openings in nearly four years, a sign that hiring could strengthen after slowing this spring… The increase in job openings suggests that weaker hiring gains in March and April could be temporary.
We have argued for quite some time that the recovery would be driven by gains in U.S. employment. Our ‘macro’ view is that the balance of this decade will feature a trend driven by U.S. capital spending and Chinese consumer spending. We expect that over time the U.S. will find new and innovative uses for its shale gas reserves while importing less crude oil to the benefit of the dollar.
The point is that there is a reason why the cyclical trend has been linked so closely to weekly jobless claims and monthly U.S. employment data. The reason, of course, is that the cyclical trend is, to a large extent, an extension of U.S. companies powering back up, expanding, and hiring. When a soft employment report can send the bond market flying to the upside it is fairly obvious what the markets are paying attention to.
In any event… the markets are trading as if the pace of U.S. hiring will remain weaker into the autumn. The news snippet above suggests that we could see a return to a stronger trend later this month. The first option suggests a repeat of 2010 and 2011 as the flight of money towards safety helps to create yet another series of financial crises. The second option would lead to an rapid pivot back to the upside leaving those who abandoned the equity markets hoping and praying for a pull back.
Quickly… there is a certain similarity between 2012 and 2003. The stock market bottomed in the autumn of 2002 while bond prices reached a peak in June of 2003. The upward pivot for the equity markets last autumn felt somewhat like the turn in 2002 so our view has been that we are somewhat ‘in between’ trends. In other words we are ‘in between’ the start of equity price strength and the eventual peak for bond prices that serves to help confirm the return to cyclical strength.
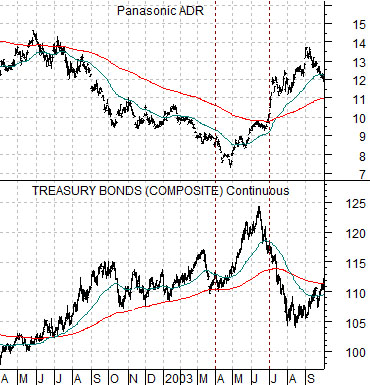
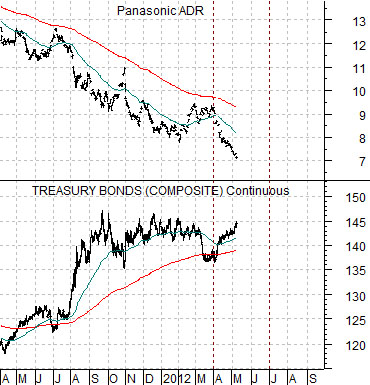
Below is a chart of Panasonic (PC and the U.S. 30-year T-Bond futures from 2002- 03 while next is the same comparison from 2011- 12. The chart detail that we have been looking for would include a strong rally by PC back to its 200-day e.m.a. line to help mark the cycle highs for long-term bond prices. We are, of course, still waiting…
Equity/Bond Markets
No markets cycle is exactly like a previous cycle so the more we focus on the comparative details the less likely we are to be correct. In a broad sense cycles do repeat but typically with just enough differences to obscure the similarities. In other words… while we stare at the chart of Panasonic it is entirely likely that the pivot is taking shape from another direction.
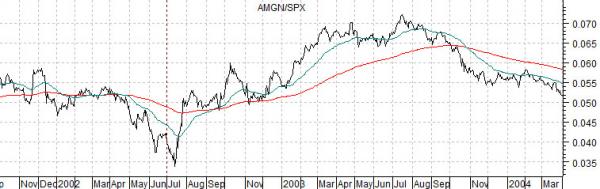
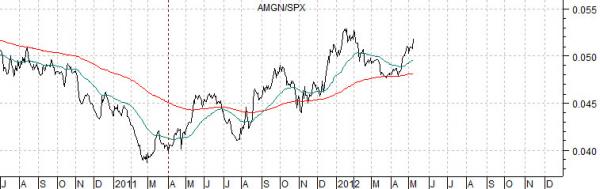
Below are two charts of the ratio between Amgen (AMGN) and the S&P 500 Index (SPX). The top chart is from 2001- 04 while the lower chart begins in 2010.
Our view is that Amgen outperforms the broad market during those periods of time when there is some amount of downward pressure on the cyclical sectors. Hmm… let’s try that again. Amgen is, by and large, a growth stock but it will lag the broad market when the focus is on rising commodity prices. When the AMGN/SPX ratio turns higher it tends to ‘mean something’ and in recent years the ‘something’ has been a stronger dollar.
For good or for bad the AMGN/SPX ratio bottomed in 2002 about three months before the S&P 500 Index turned higher and a year before the top for bond prices. This time around the ratio turned higher in the spring of 2011 as dollar strength began to pressure the energy price trend and remained stronger until the stock market pivoted upwards towards the end of last summer. Our expectation is that the rising trend is preceding a cycle peak for bond prices.
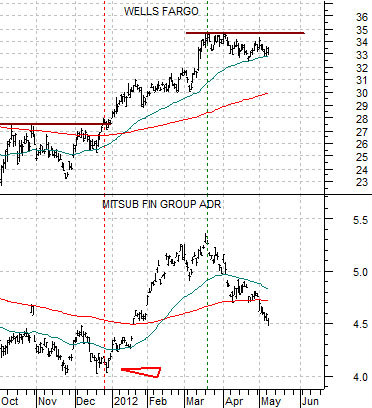
Below is our chart of Wells Fargo (WFC) and Japanese bank Mitsubishi UFJ (MTU). The argument once again is that the laggard banks (MTU) may not turn back to the upside until WFC is ready to push up and through the March price highs around 34.50.